 by
by Hi all,
Markets are bouncing back not only in Nifty but all over the globe. SPX 500 and Nasdaq are going from strength to strength in recent times and are now trading well above 50 DMA, as of today. But will it continue to show strength, will be revealed by the market itself in the coming days.
Whenever the market goes into corrective mode I get more excited to look into charts, I become vigilant and that’s the perfect time for anyone to look into strong stocks. The leaders of the next cycles are emerging out of the cocoon and one should be able to get them early on. If you want to know how to look for the next leaders in a downward market cycle then read the article here.
Relative strength is one thing which is advocated by great traders, right from David Ryan, Mark Minervini, William O Neil etc., But, knowing the concepts and applying them in real time is very different.
Though I had written few articles on relative strength, like Using Relative strength of INDIA VIX to identify the market trends and USING RELATIVE STRENGTH as a Market Breadth Indicator, in this article I wanted to discuss how one can read RELATIVE STRENGTH in a more deeper way as it gives us the clues, to spot the turnarounds easily. Though it’s not that difficult to find the clues, what is difficult is to apply it in real time.
Relative Strength: Defying the Gravity:
By defying gravity I mean, that the stock with higher relative strength has the ability to move faster than the others. If the market is moving 10% the stock can move 30,40 or even 100% or more in a very short time.
While most stocks come under the radar, when it’s making new highs and has moved substantially, the real movement would have taken place months before. Some call it a “healthy base developing period”. Some as “accumulation phase” etc., Whatever the name is, the simple concept is, the stock after a breather is getting ready for the next leap.
But, at times even after the formation of a healthy base, very few stocks perform tremendously while some perform above average and many fizzle out. Won’t it be nice if we have a quantitative measurement of these things? Answer is YES. It lies in relative strength reading.
I am going to discuss with chart examples on how to find these DARK HORSES.
The Stock Strength VS Market Strength:
This concept is simple. You just have to look for stocks that are performing relative to the market and at the same time forming a good base.
STEP 1 :
Find stocks that have fallen more than 30% from their all-time high and not more than 60%. Stocks that have fallen more than 60% have heavy resistance on the left side of the chart and are prone to fail.
STEP 2:
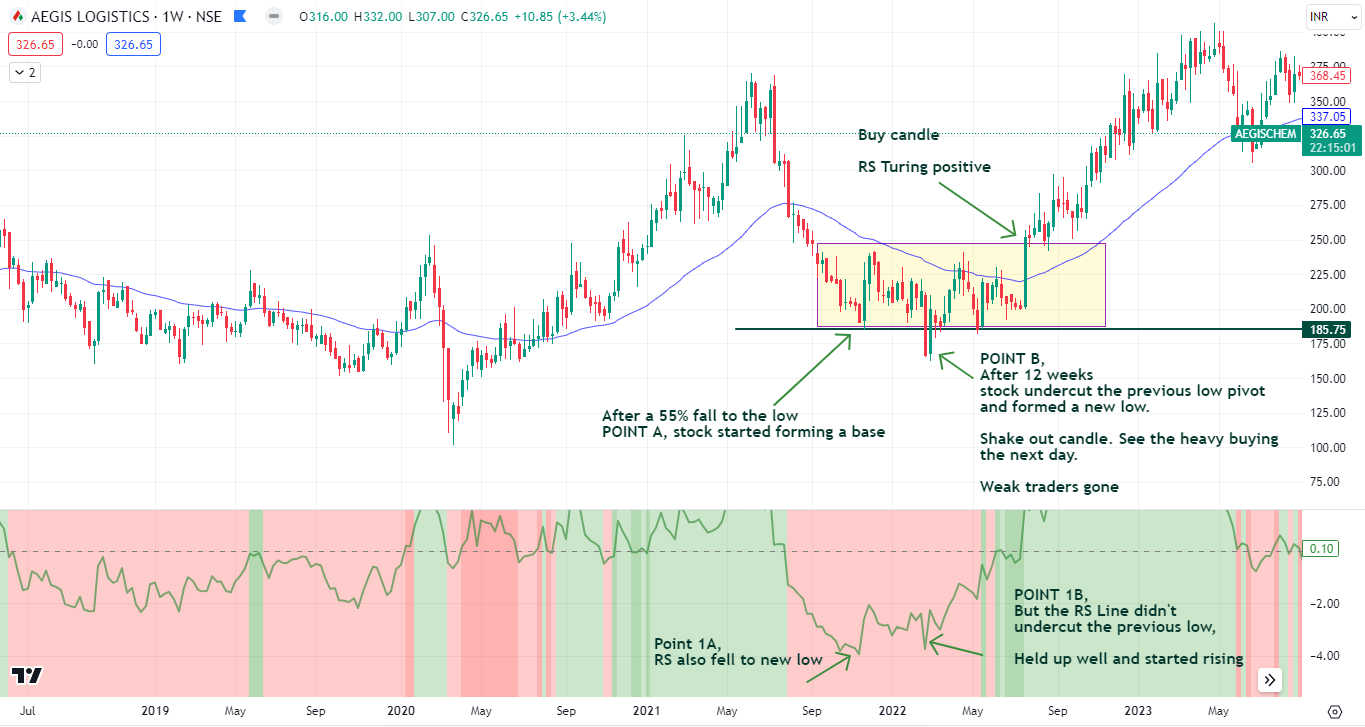
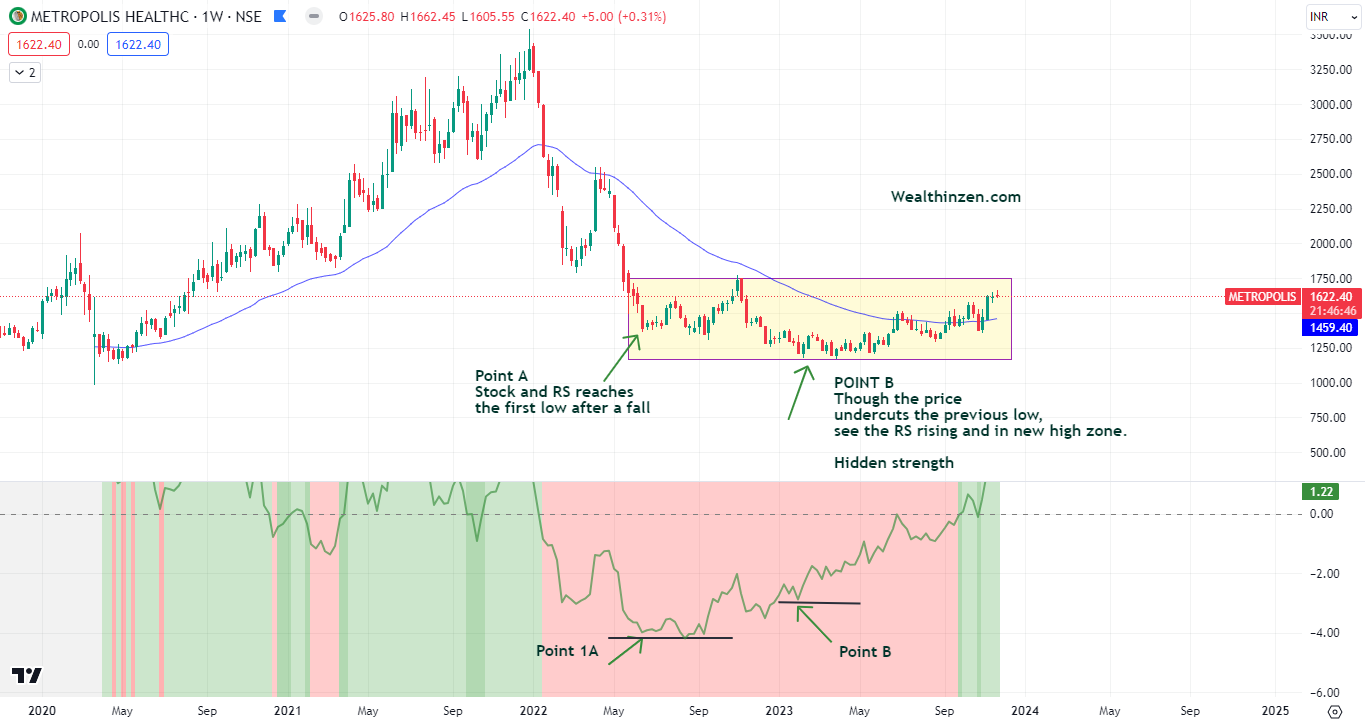
See whether the stock is forming a healthy base. If yes, note the lowest point on the first fall (POINT A). Now note the lowest point in the RS indicator line also on the same day (POINT 1A).
STEP 3:
Now locate the second lowest point in the price chart of the stock, it may or may not have breached the first lowest point (POINT A). If it has breached the first lowest point marginally it is better, it represents the shake out. Also called as UNDERCUT. Now, this point is POINT B.
STEP 4:
Now, see the corresponding low point in the RS Line indicator – POINT 1B. If this point is higher or far above the POINT 1A (previous low point of RS Line) then it indicates strength.
Now let us see some past examples and Current Examples:
DISCLAIMER:
Stocks mentioned here are for study purposes only. They might be well below or above the buy price range. I may or may not have positions in it. Please don’t buy the stock without researching. All the stocks mentioned should be analyzed well fundamentally before buying. Kindly do your own research.
Past examples:
All the charts use the MANSFIELD RELATIVE STRENGTH INDICATOR by Ostapchester. Just search in the TradingView Indicator section and you will get it. Moving average is 50 EMA in daily and Weekly.
Below is the chart of AEGISCHEM, see how the stock took off after falling to nearly 55%.
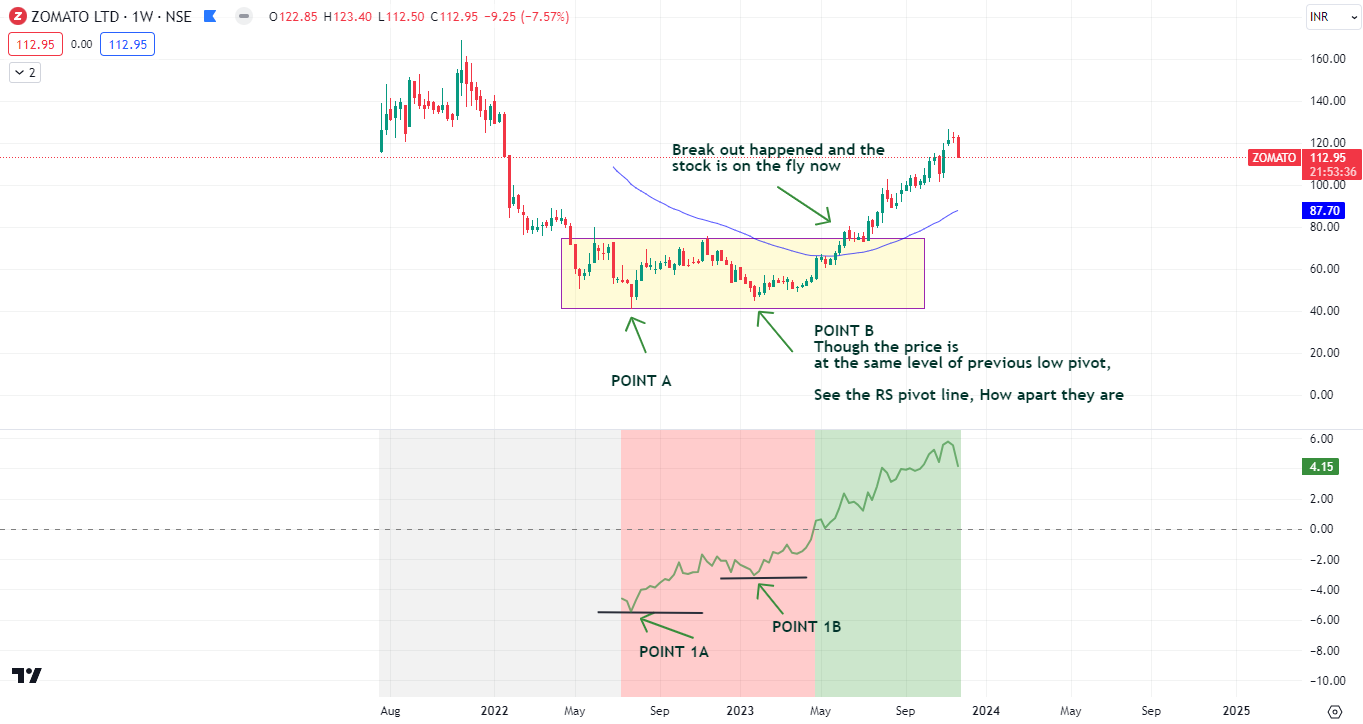
Another recent example that is doing well is ZOMATO. The stock had ripped off the IPO applicants and retailers. IPO was issued with a lot of expectations. But it fell nearly 76% from it’s all-time high. That’s why I always avoid applying for IPOs even though the expectations are fantastic. I had written an article on How to spot the IPO winners and make a killer Profit?. Read it, you will understand what I mean.
See the chart below, self explanatory:
Now, we have seen these past examples, let me show you some charts which are doing something similar to the above examples.
See how history repeats itself. It’s just you and me that has to be vigilant and take note of these small things. Small things gradually scale up and explode in a day or two. If our stock should be on the day of the explosion, we should already have positioned well there.
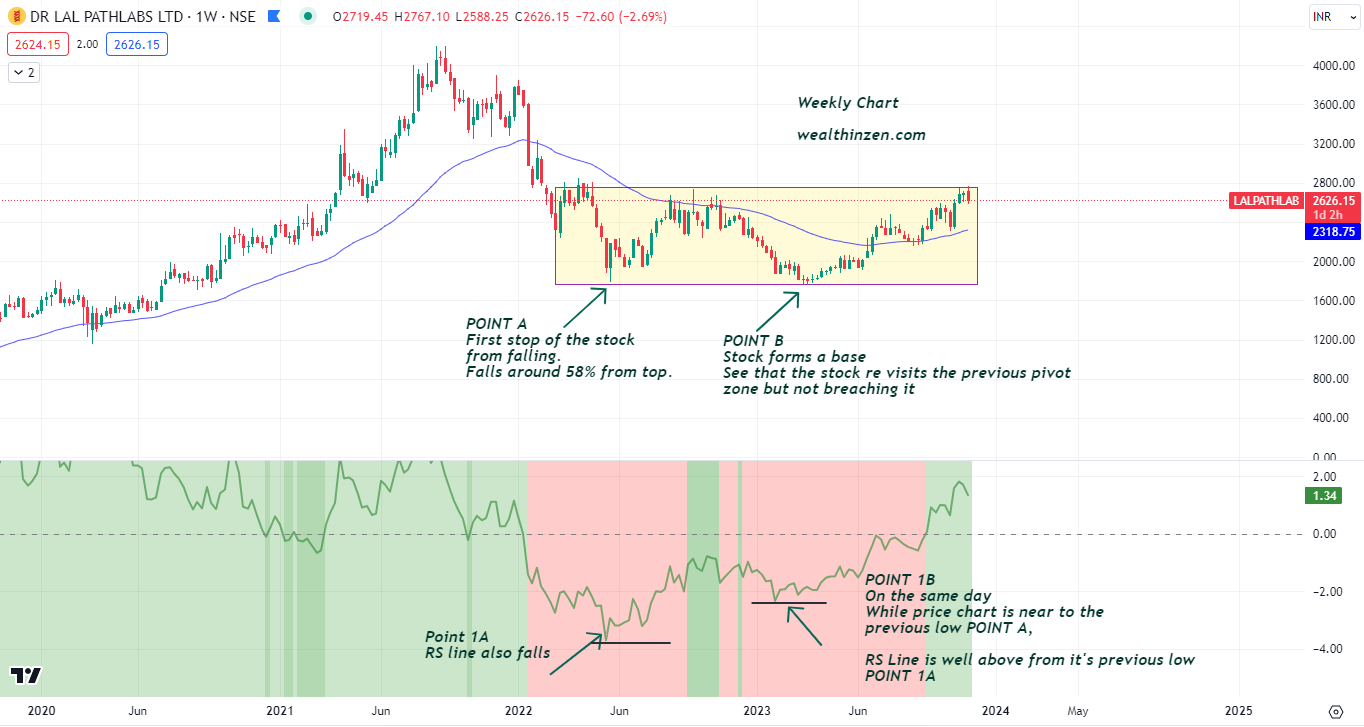
Below is the chart of LALPATH, almost on the verge of breakout. (Not a recommendation)
See the chart below: METROPOLIS
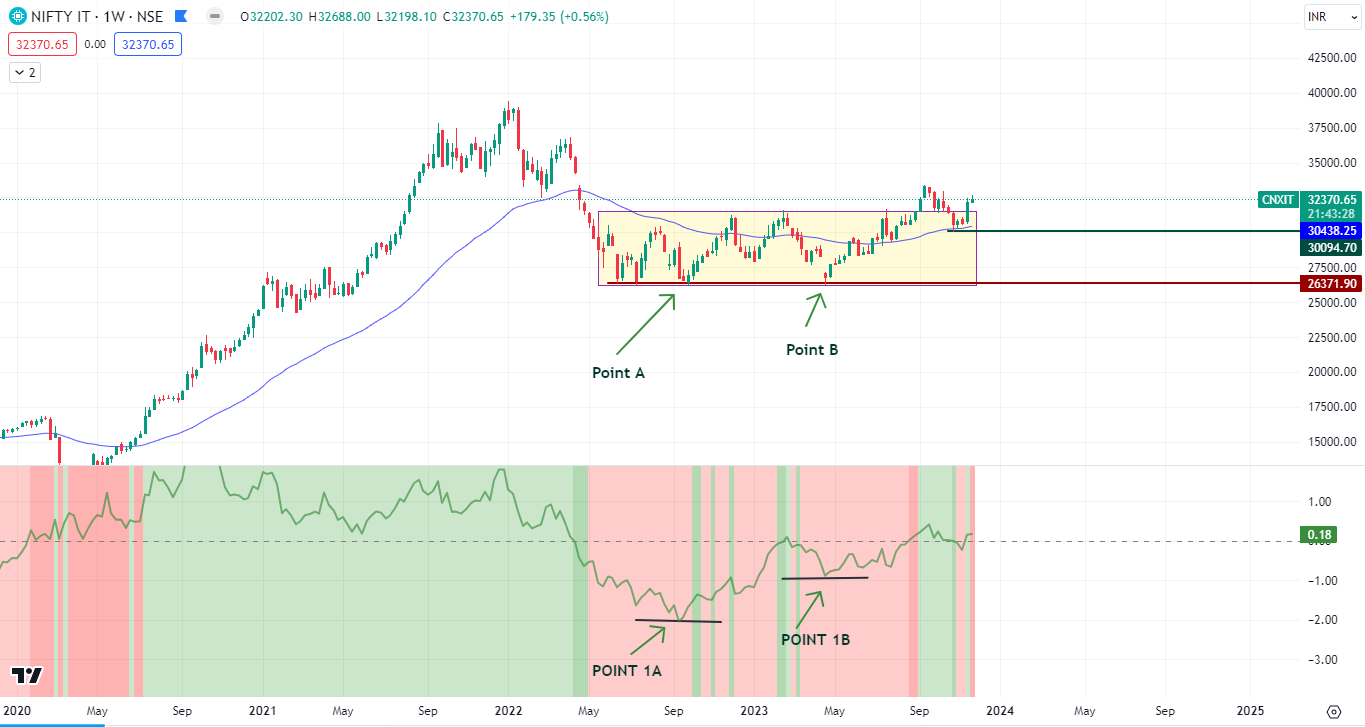
This technique is not only applicable to Stocks, It can be applied for sectors also.
See the below chart of NIFTY IT. See how beautiful the sector is setting up. Trained eyes would have already taken positions in IT related stocks.
FINAL THOUGHTS:
I hope now you would be clear on how to read the Relative Strength patterns.
But, this is just one piece of the puzzle. There are many things like proper position sizing, risk management, Psychology.
Also, selecting stocks is an art. Learn the art of stock selection, using relative strength . However, this will come by experience only. I am also exploring. So don’t worry, we will get there.
You can use my free Position sizing calculator tool to decide on how many stocks to buy.
Also, note that these are potential turnarounds. They have a lot of resistance on the left side.
For example, though Metropolis seems good in Healthcare sector, my preference would still be in other stocks like MAX Healthcare, Apollo, ABBOTT etc., which are already at or near All time Highs.
I personally like stocks that are trading in or near All time high zones (20-30% near ALL TIME HIGH ZONES).
So, select stocks according to your risk profile and after studying a lot about them. Don’t blindly invest / Trade.
See you soon guys with some other interesting topics if I come along. Do subscribe, if you like my articles. I also post my past trades in a journal format. You can see the journal with charts and explanation here.
Happy Investing !!!


Seems this concept applies to RS warriors indicator also. Does this works Most of the time. i know in Mkt nothing works all the time.
Yes it will work for any RS indicator. RS warrior indicator is based on six month time frame that is – SRS 123. So around 6 months.
The indicator I had mentioned in article is 200 days. Almost a year. Longer time frame gives more conviction and lesser whipsaws.
You can use any. But be consistent.
Regards,
Happy Trading!!!
Hi ,
I really liked above post, thank you very much for sharing with the world.
1. when dealing with the indian market we need to change it to the Nifty or sensex, which one you prefer.
2. And what is the logic behind 50 EMA for both Day and Week.
3. As per my understanding it should be different as time covered by EMA has to be different.
4. How you define the correct time to enter in a stock.
Hi sorry for the delayed response.
1.For Indian market, I prefer using Nifty 50 than Sensex. No particular reason, just preference. You can use any. But stick to it
2.50 EMA I use it for Daily only. 50 EMA in weekly is just a default setting you see in the chart. I use 30 WMA to determine long term trend. I Don’t use 50 WMA for analysis. EMA Mentioned is only for Daily Time frame.
3. Yes, it should be different
4. Correct time to enter the stock is when it breaks out of a good consolidation zone. If it retraces and retest the breakout zone, I will add more to that position when the stock shows strong strength. (Wide range candle).
You can read my trades which I post regularly in my trading journal series. You can see how I enter and exit
Dear Sir,
Excellent…… I’m a tamil medium person….. your english is very simple and very easy to understand….. thank you s lot….
Your teaching is unique
We can’t find this information in any of the book / online videos Or from any market experts
Thanking you
R. Narendrababu
Hi Narendrababu
Thanks for the kind comments. Wishing you all success. Ungal vetrikku en vazhthukkal.