 by
by Hi all,
Today, I am going to present one of my trade journals. I am planning to write and publish all my trades I took in the last cycle, MARCH – SEPTEMBER 2023. I will also publish my lost trades, my mistakes and also how I saved myself from disasters, by following some simple rules. This will be a series of my Trade journals, which I will call “ TRADING JOURNAL SERIES”. So, let us drive straight to the topic.
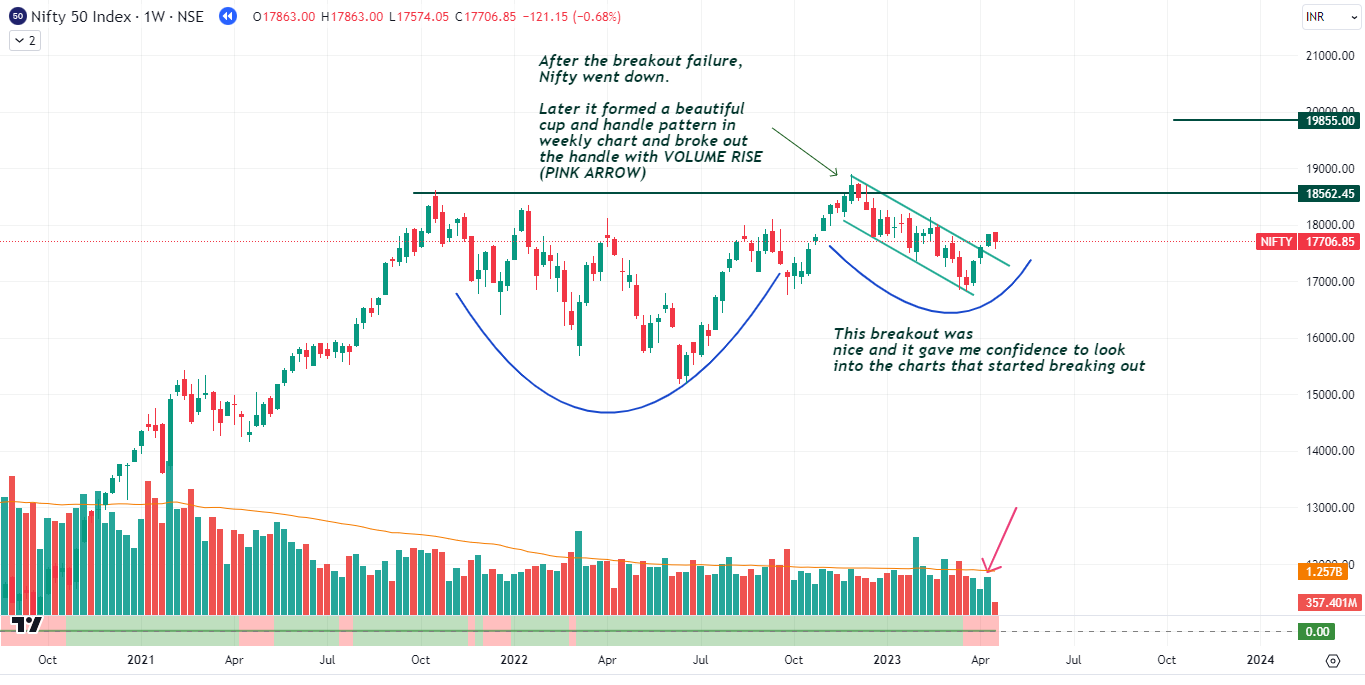
This trade was taken during the period of April – September 2023. The market was recovering from a downfall after March 2023.
See the chart below:
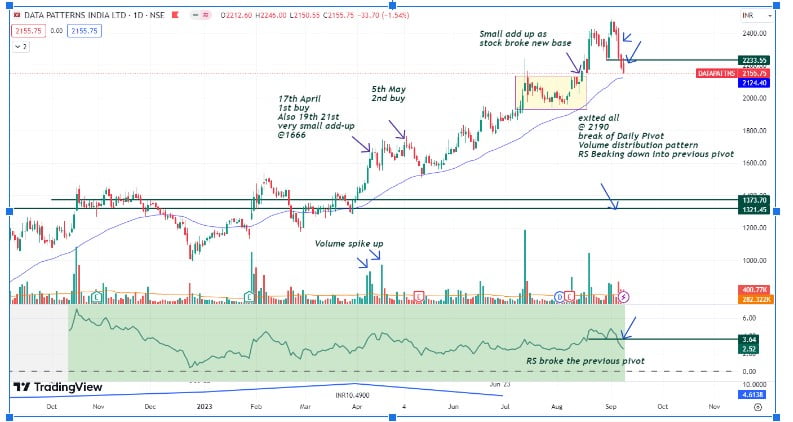
I witnessed some stocks breaking out of a good base and started to take pilot positions. One such trade I took was DATA PATTERNS which is a defense stock.
The stock formed a healthy base, with positive RS (Relative Strength) even during the weak market phase attracted my attention.
The fundamentals of the company seemed to be “Ok” but not very impressive. Below is the screenshot of fundamentals from Marketsmith.
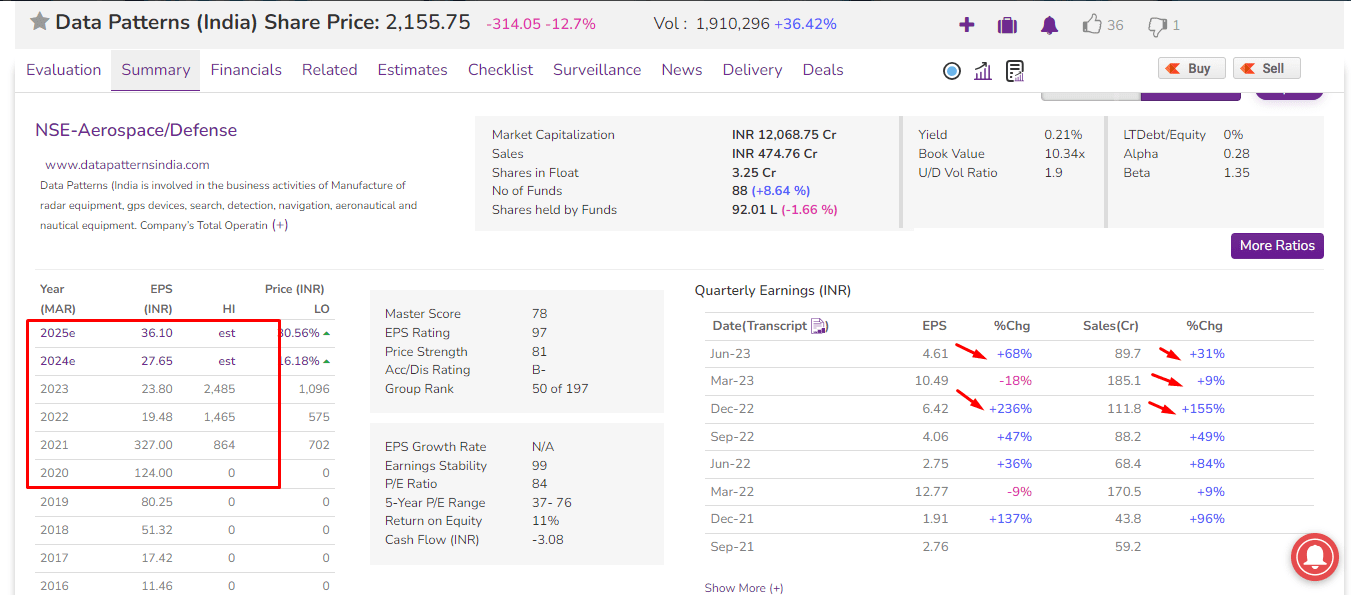
Not that much impressive YOY EPS Growth (Red Box), but see the EPS % Change Quarter on Quarter. Looks good also see the sales growth, for the past 7 quarters it has given positive growth sales % when compared to the same quarter previous year.
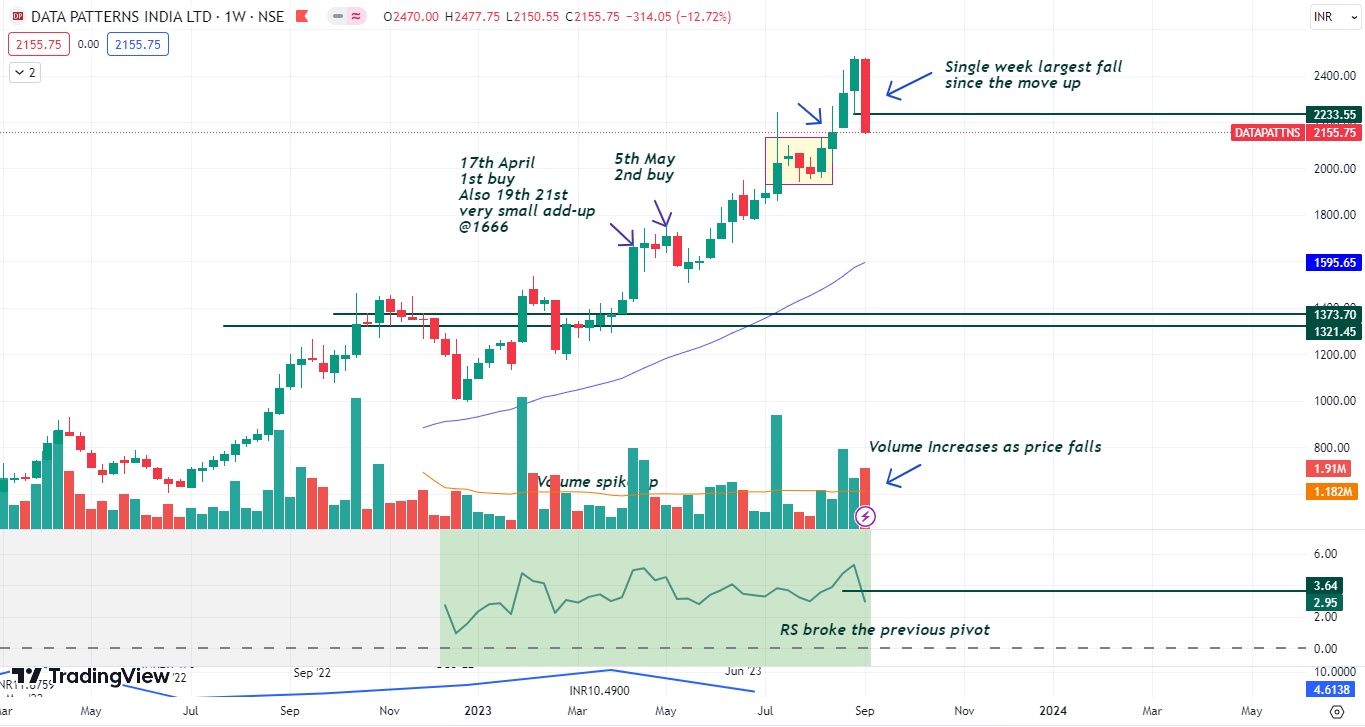
As you can see below, the first position was taken on April 17 th as it entered into the ALL TIME HIGH Zone with a strong monthly close.
All the chart images are mostly self explanatory. I am writing this article as a record for myself and also for any other fellow traders who want to improve their skills in trading.
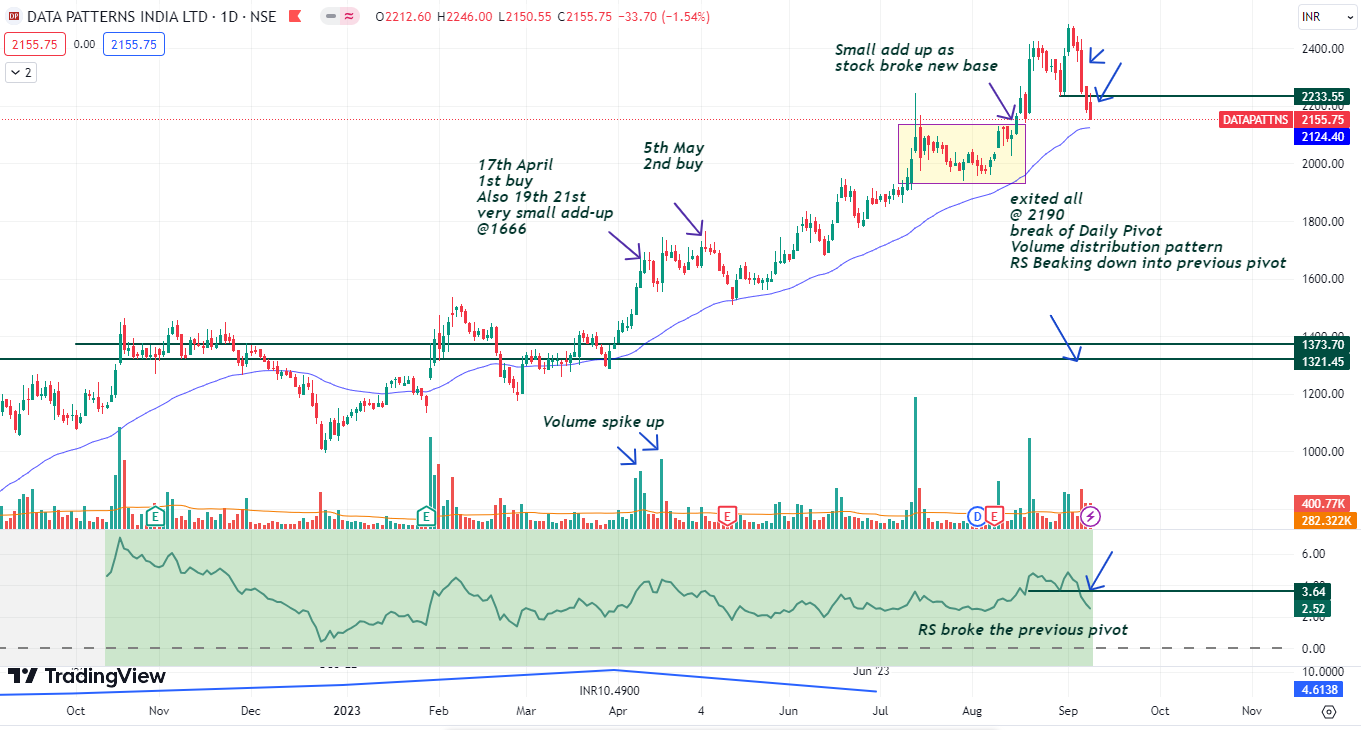
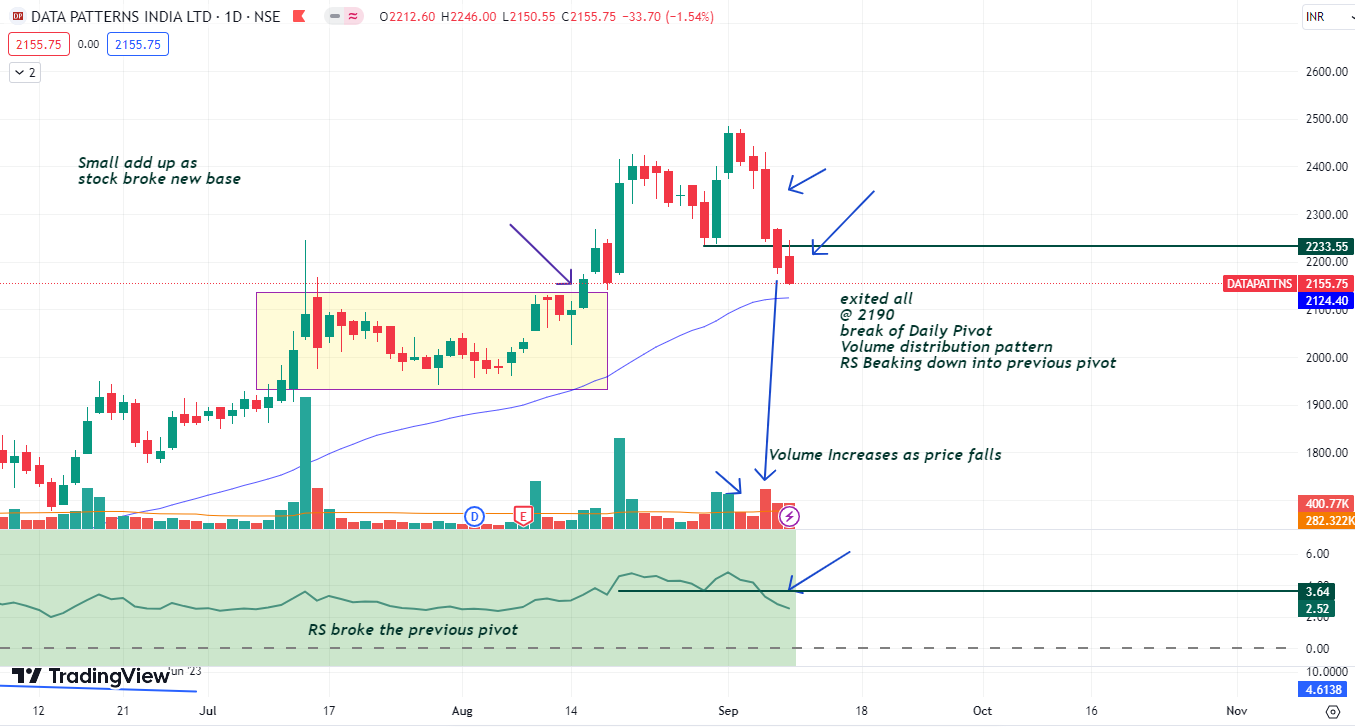
See the below zoomed daily chart showing the price action breaking the previous pivot with Volume rise. When this happened it’s time to exit all quantity.
Below is the weekly Chart of DATA PATTERNS. One can see how the stock dropped in price in an unusual pattern. It witnessed one of the largest falls since the price took off in APRIL.
Again, look at the volume rise with price fall.
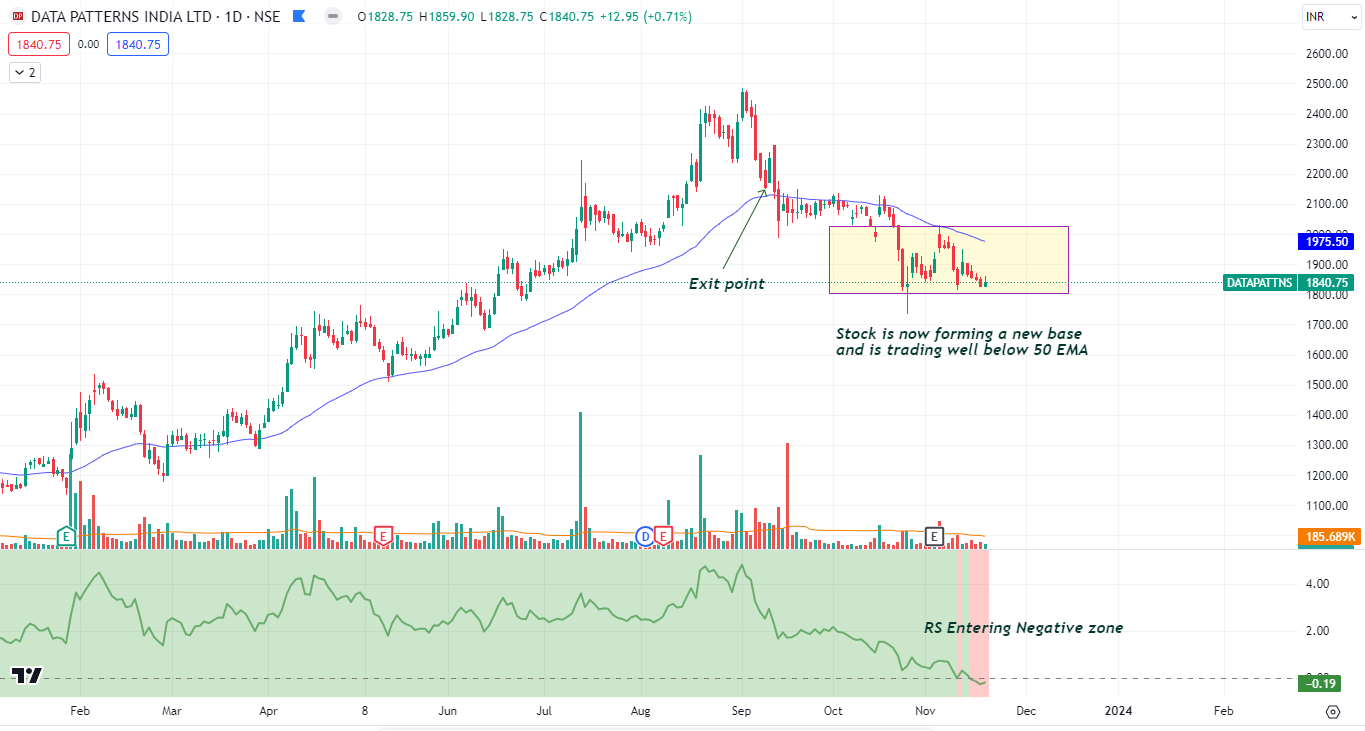
Now, after the trade is over, it’s my habit to see how the trade went after a few days / weeks. The stock will still be on my watchlist. If it gives me a good entry point, in a few weeks time I may again enter it.
However, in this case of DATA PATTERNS, the stock kept on going down. But the stock is still in my watchlist as it is trading near to the All time zones.
DISCLAIMER – Kindly understand that there are “N” number of ways to trade. My entry, position building techniques, and exits can be done differently by different traders. For some it may look like a late entry, while some may think that I exited too soon. It all depends upon the psychological makeup and the risk profile of the trader.
So, if some points seem to be irrelevant or if you think that it could have been done the other way around, I agree with you completely. It’s just that, this is how I trade and my trading style may change in future as I evolve as a trader.


4 thoughts on “Trading Journal series – DATA PATTERNS”