 by
by Hi all ! Last week I had written an article on “ How to gauge the market breadth using Relative strength “ and in that I had shared my views on why the market may go higher. And as of today Nifty has gone into all time zones decisively. It’s really good to see when such good decisive breakouts happen.
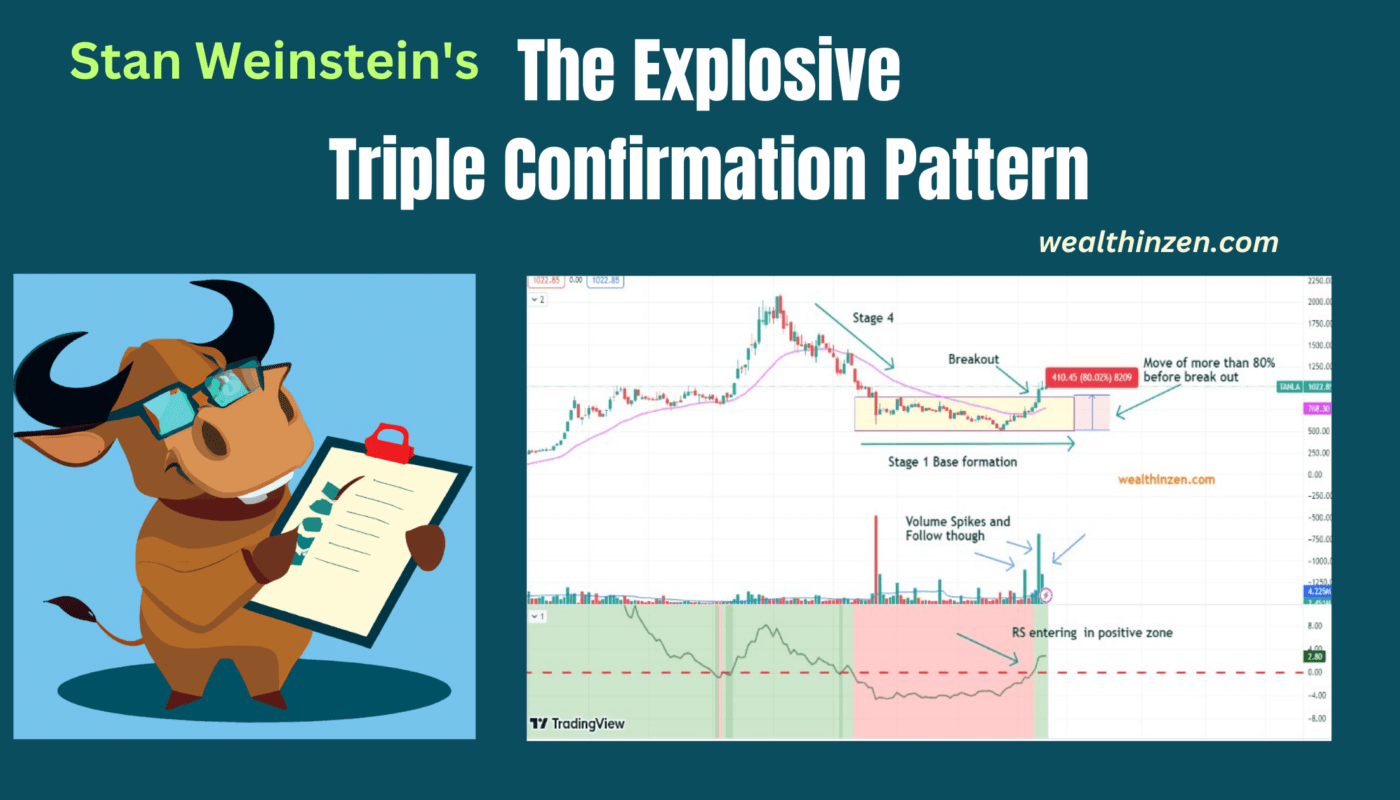
So, with the markets in ATH zones, I am going to share with you all a powerful pattern described by STAN WEINSTEIN in his book “Secrets for profiting in bull and bear markets. This is an extraordinary book and every serious trader or active investor should read this book as many times as possible.
Stan Weinstein introduced this technique way back in the 1970’s. But, one will be surprised that these things work even today and will be working in future also. That is the power of price action. Price action is eternal as it reflects the emotions of the buyers and sellers and the emotions will remain the same in generations to come.
This pattern is also called a triple threat pattern by STAN and let’s discuss what it is all about and how one can use this for our trading success. Kindly read the entire article when you have enough free time. Many key points of STAN are discussed here. So if possible, read again and again to get more clarity on the topic.
The Volume Signal – First confirmation:
If you have read the STAN book, you will be familiar with how he advocates a rising 30 week moving average and his stage analysis. Always look for a stock that is forming a base. The base is very important.
See the image below explaining the four stages of a stock price journey.
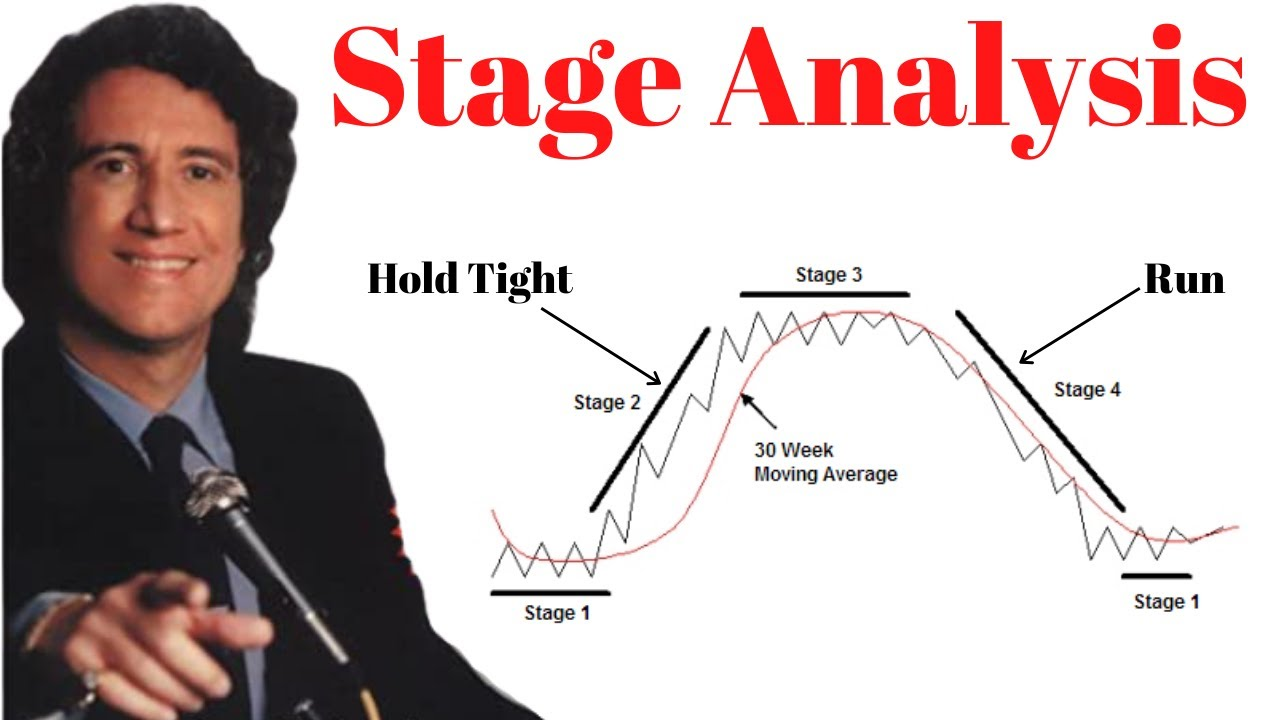
We should be looking for a stock that is in Stage 1, and a breakout from that stage. When such a breakout happens, it should be accompanied with heavy volume. Volume should be at least two to three times of the average past four weeks volume.
This is very important. If the volume is not good then the signal is not valid and the stock should be skipped.
One more important thing to note is the volume should increase in subsequent weeks or at least should maintain the same range of volumes. This is called a follow-through volume pattern and most of the times it signals institutional buying. Read my article on “ How to spot institutional buying using ANTS Indicator by DAVID RYAN”
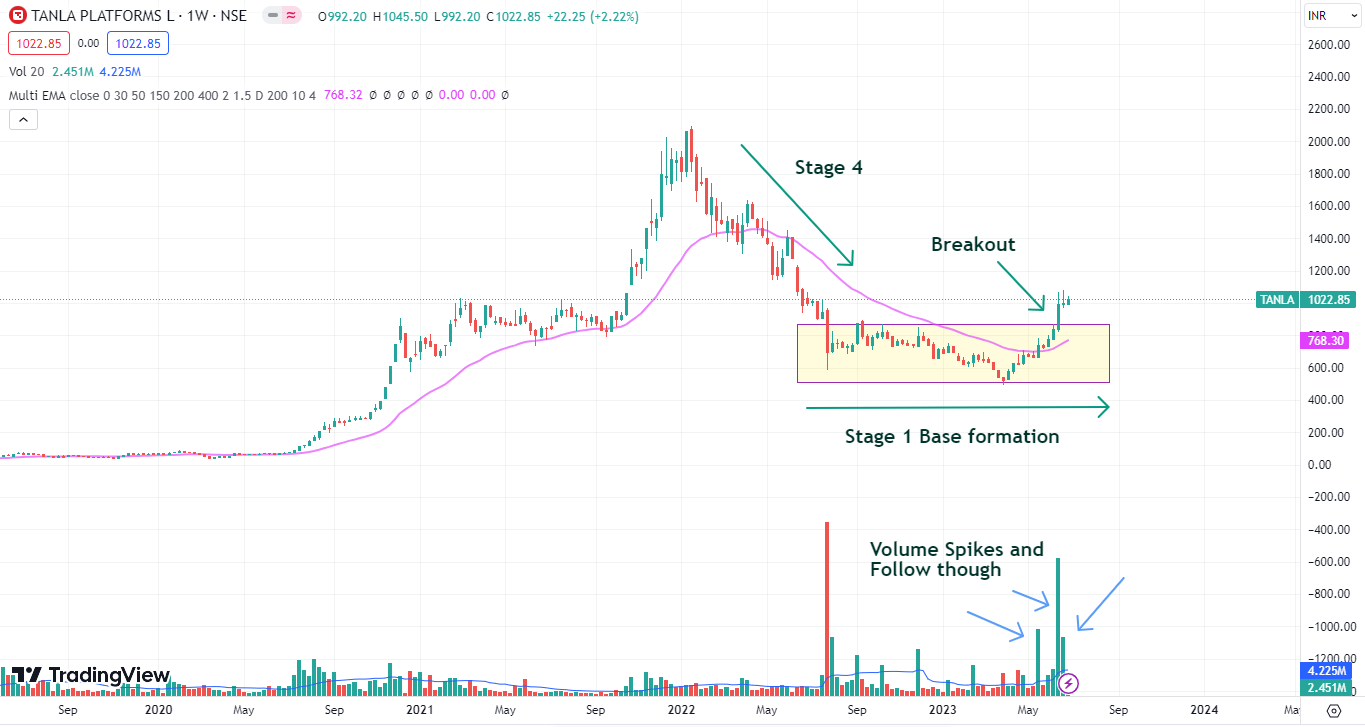
Throughout this article we are going to see the example of one such stock that is showing the TRIPLE CONFIRMATION PATTERN. The stock name is TANLA. All charts shown are in weekly Time Frame.
(Kindly note that I don’t have any positions in TANLA as of date today and it is not my buy recommendation. The stock might have gone above the buy price already when this article gets published. Do your own research before investing. The stock is mentioned for study purpose only)
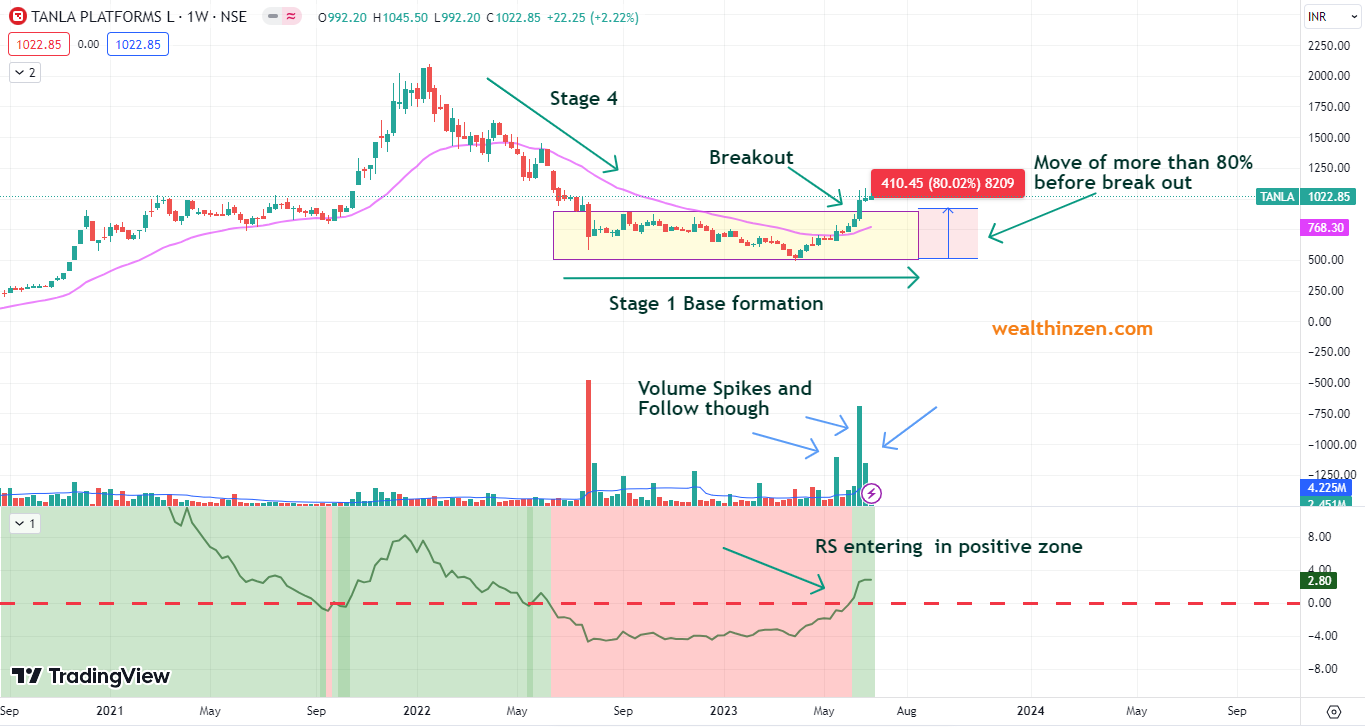
See the image below. Weekly chart of TANLA. After stage 4 the stock started forming a good base. Now, the stock has emerged from the base and has broken out with heavy volumes. See the volume spikes (Blue Arrows) before the breakout, on the day of BO and after it.
Relative strength – Second Confirmation:
Almost in all my articles I keep on telling how important it is to analyze the relative strength for trading success. You can read my article on “How I select stocks based on relative strength”.
It is a well established fact that one should always buy a stock that shows positive relative strength.
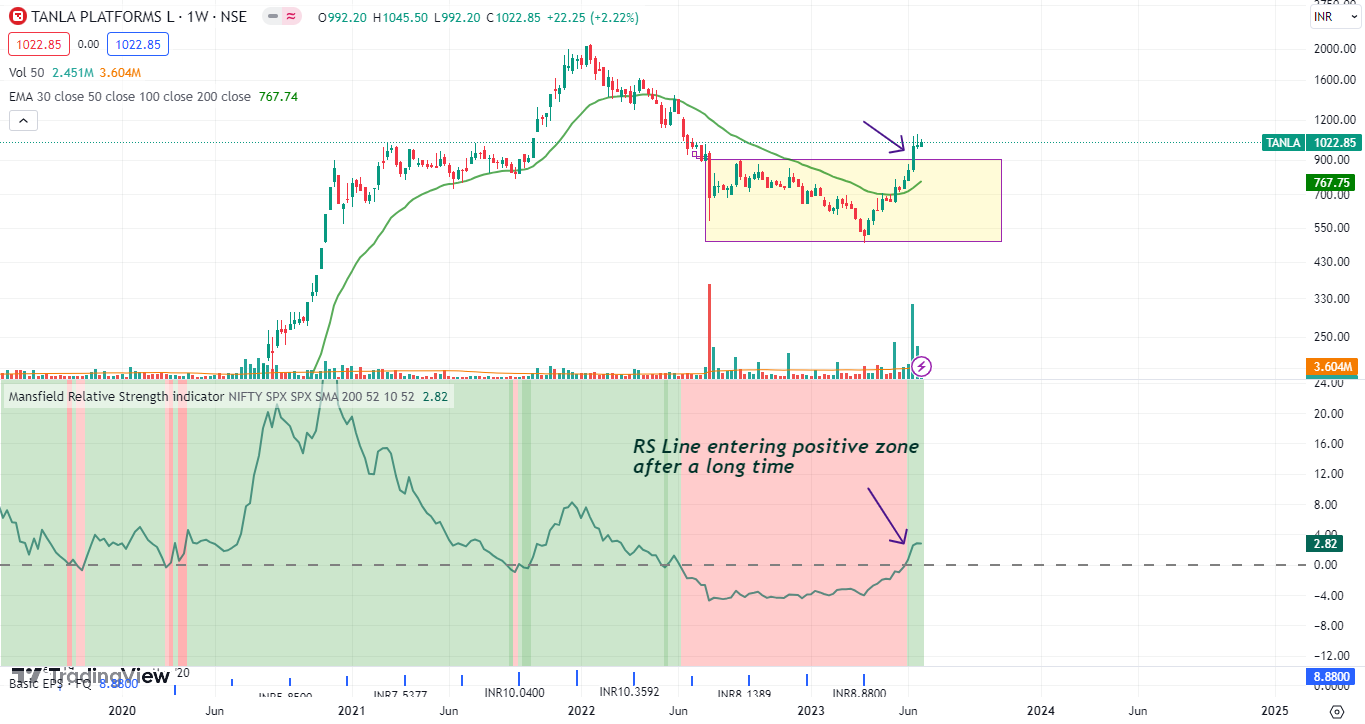
Stan in his book also emphasizes that. But in this triple confirmation pattern, he tweaks this relative strength rule a little. What he advocates is instead of buying a stock that is already in the positive zone, look for a stock that has been in the negative zone for quite some time and then suddenly enter the positive zone.
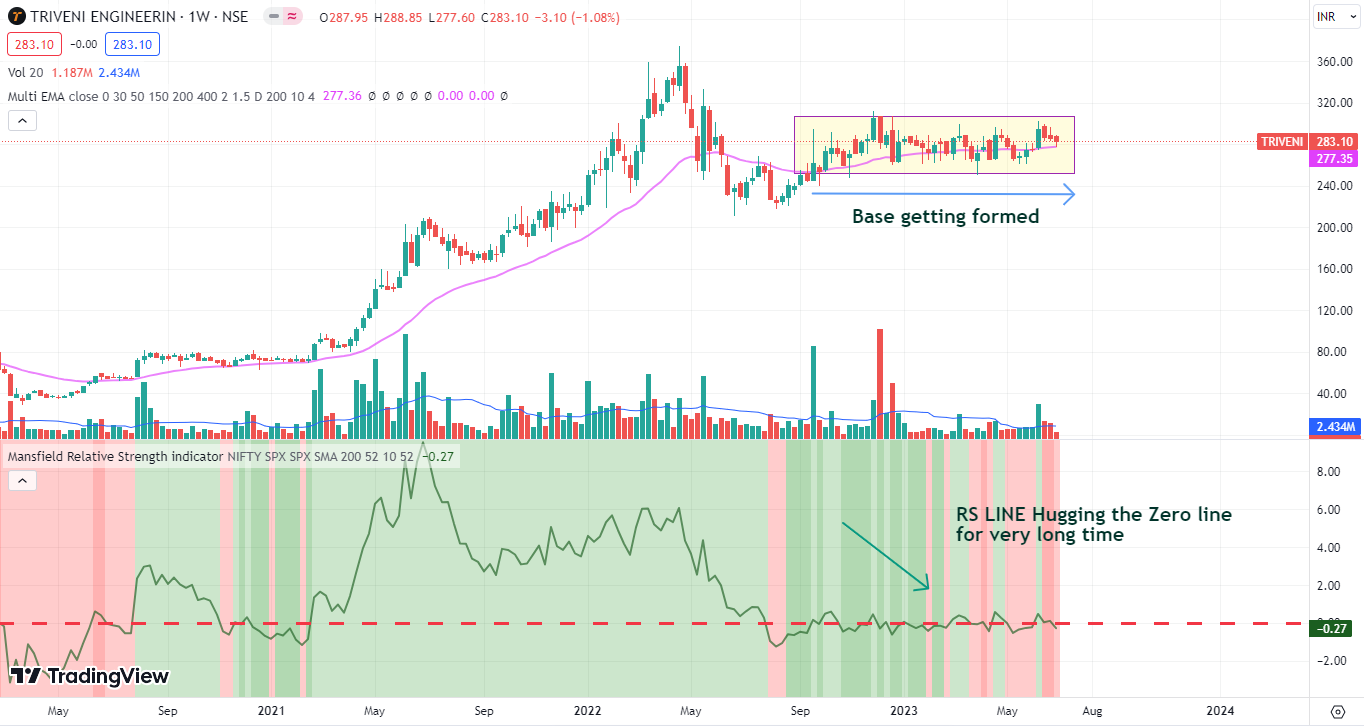
Or look for a stock whose relative strength line is hugging the zero line.
In our stock example, TANLA – the stock was in the negative zone for a long time and now it has decisively entered the positive zone. See the image below:
I will also give an example of what Hugging the zero line of RS means. Below is the chart of TRIVENI ENGINEERING. See how the RS line is hovering around the zero line for a very long time. Sugar stocks are on hold for a very long time and this stock can be kept in our watch list and can initiate positions if all other criteria proved to be good. (Not a recommendation)
Big move before Breakout – Third Confirmation:
The next point may be a little surprising to a normal trader. STAN advocates that the stock should have moved a good percentage before the breakout itself. For a trader, who always try to buy a stock at a cheap bargain, understanding this point may be a little difficult initially.
But, see if the stock is going to go 200-300% or even 6X at times, you need a propellant to push the stock to that height. STAN advocates that the stock should have moved at least 40-50% before the breakout. Even other brilliant traders like MARK MINERVINI say the same point. Mark even prefers a move of more than 100% before the breakout.
I had written an article on “HOW TO SELECT STOCKS BASED ON MARK’S TREND TEMPLATE”. Check that out. Will be very useful.
Now, in our example see the chart below:
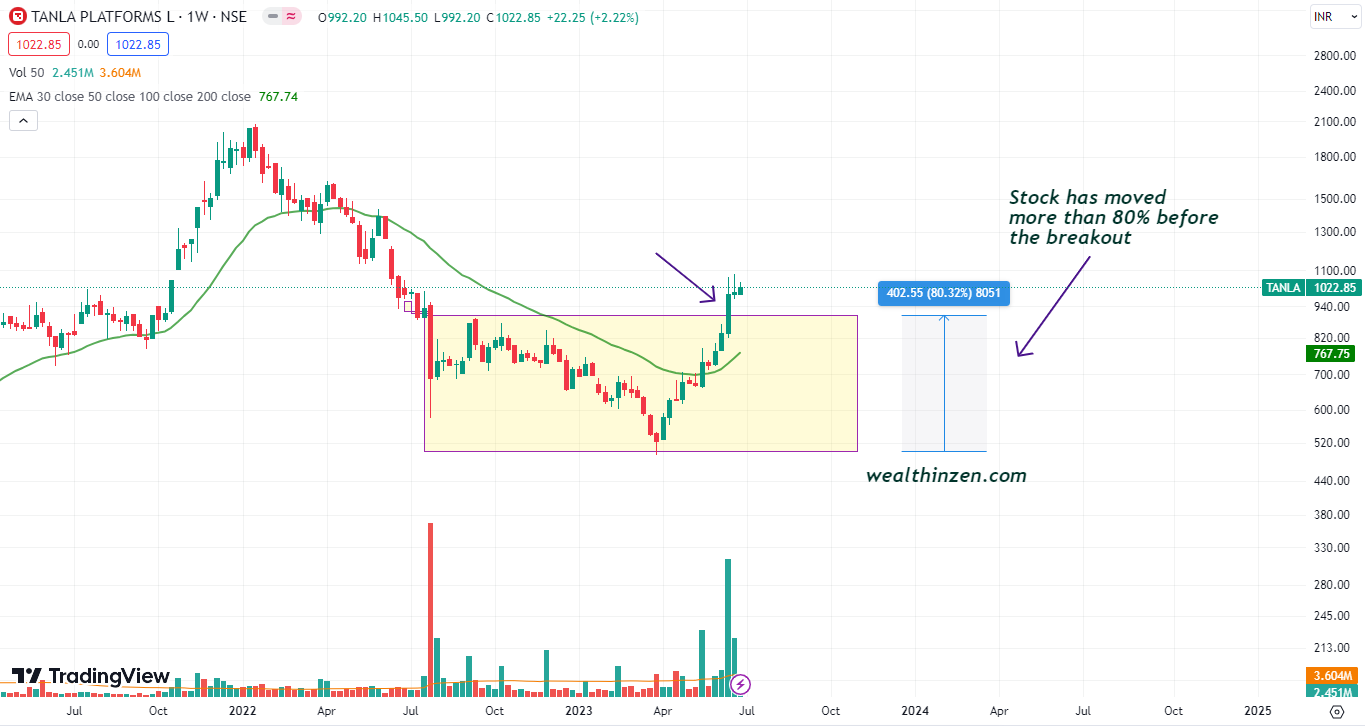
TANLA has shown tremendous move before the breakout. It moved almost 80% before the original breakout occurred.
Points of Caution in the Pattern:
Now, we have seen what a Triple confirmation pattern is and how it will look like. But, STAN also teaches us, some points of caution before jumping onto the trade.
First, this pattern works extremely well only for the patient trader / investor. Investors should be ready to witness a price halt. You can’t expect the stock to go up another 80% in a month’s time. You should be ready to wait a long time. It may be even a year or two if you want tremendous gains like 200-300% or even more. Structures take time to form. The more you understand this, the more you will develop patience.
Don’t try to book out profits soon. This pattern should give you a risk reward ratio of at least 1:6 or 1:10 or even more. Understand the Risk Reward in its true sense.
Also, keep your stop loss to a reasonable level. If I am taking the trade my stop loss would be either at the bottom of the base or a strong close below the 30 WMA. Select a stop loss based on your risk appetite and position size the number of stocks you can buy, accordingly. Use my free position sizing calculator tool to decide the position size.
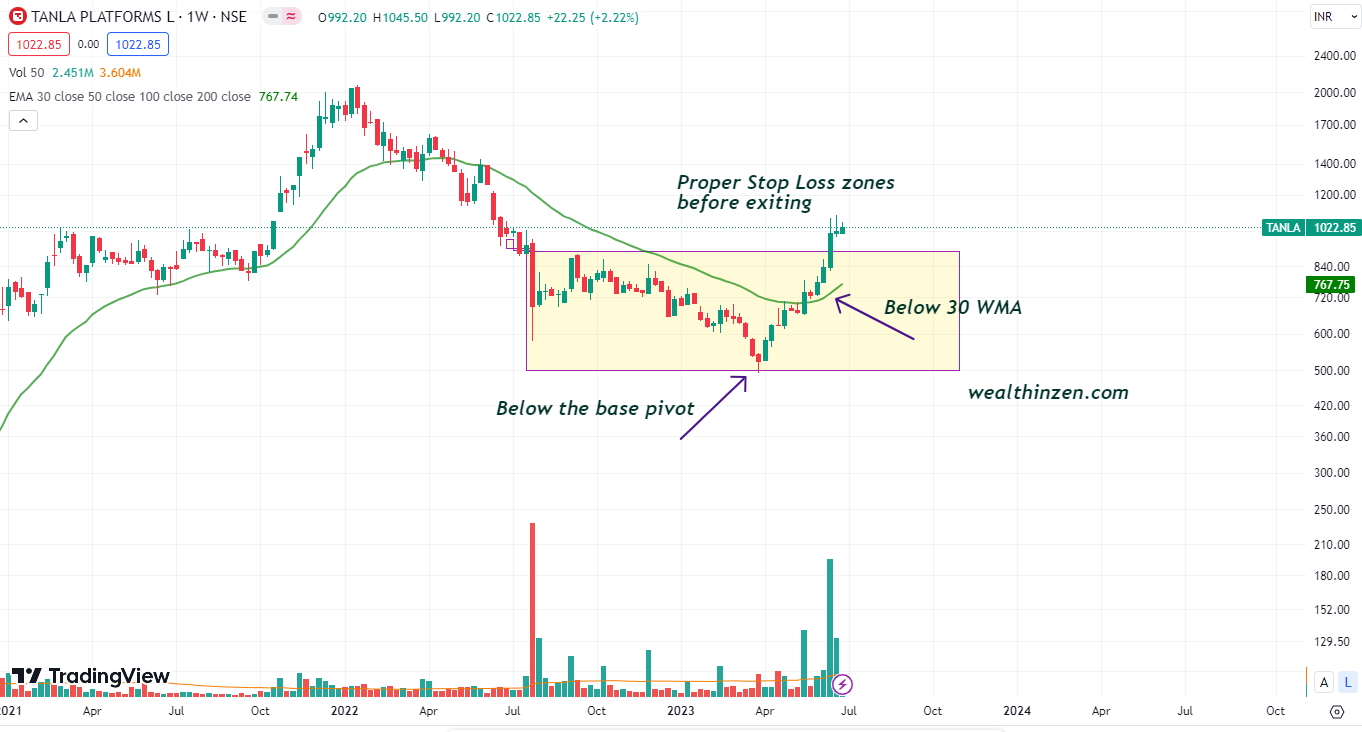
Summarizing All Criteria:
See the below self explainable chart:
Get Updates Regularly:
I like to write a lot about the market and share my views. I am sharing only my thoughts and I may be completely wrong in my analysis. So, do your own research before making any decision.
If you like my writings you can share with your friends or colleagues and can subscribe to my newsletter, so that my articles reach your inbox directly.
Thank you !!! Happy Investing !!!


ANTS INDICATOR IN TRADING VIEW by David Ryan
It’s not available. Can u please post one chart with this indicator could be useful. 👍👍