
 by
by In my previous article I had discussed how to select stocks based on relative strength after a bear market. As I am writing this today, (Dec 1-st week 2022) Nifty has already reached an all time high and the global markets are also recovering to some extent. Though the global markets will take much more time to form a base and then rise from there, Nifty will be hopefully forming newer highs frequently with sharper pullbacks in the near future. Keep tracking these five key data points to get a larger picture of what may come in the future.
The previous article focused on how one should select stocks after a bear market and how to use relative strength to identify strongest sectors followed by the strongest stocks. It was a top down approach which is very useful after a bear market. However, as the trend of NIFTY matures and it keeps on forming new highs, most of the sectors will start outperforming the Nifty and hence most of the stocks will have strong relative strength compared to nifty.
So, the stock selection will be difficult at those times if one has to enter positions, once the trend starts maturing. I found Mark Minervini’s trend template to be very useful in those situations and in this article I will be sharing those criteria that are needed to select a stock and also how to filter stocks using a free scanner based on those criteria.
This type of stock selection is more of a bottom up approach than top down approach that was discussed in my previous article. This approach gives more weightage to the stocks and not the sector or the market.
Disclaimer:
I am not a registered analyst. I am just sharing my thoughts to all of you for educational purposes only. I don’t claim that this method of stock selection is the best or the only right method. All the stock names discussed in this article should be considered only for educational purposes and not a recommendation.
The logic of Mark’s selection process:
The concept is nothing but a combination of Stage analysis and momentum. Any stock that is considered worth buying should be in a clear Stage 2 structure. In other words it should be in an established uptrend already.
An established uptrend signifies momentum. As per the momentum law, what goes on will be going on unless and until there is an external force to stop it. So, selecting a stock with these characteristics, increases our odds of success and helps us to be on the right side of the play.
Identifying Stage 2 stocks using Moving averages:
Moving averages are an excellent tool in trending markets. Mark gives us a template called a trend template to identify strong performing stocks in clear Stage 2.
According to that template, the latest price of the stock should be above the 50 day moving average (DMA). Remember that you can use anything either simple or exponential moving averages. But be consistent with what you use. The template is as follows:
The 50 DMA should be above the 150 DMA.
The 150 DMA should be above the 200 DMA.
Point to note is the moving averages should be aligned in the exact same order as said.
Also the 200 DMA should be trending up at least for a period of 1 month.
This template helps us to narrow down those stocks which are trending higher and higher. Most of the stocks falling under this category will be in higher high and higher low structures, a classic sign of Stage 2 stocks.
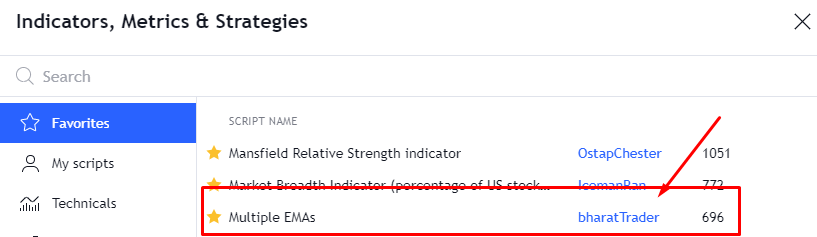
To plot the multiple moving averages- just go to Trading view and go to indicators and select Multiple EMAs by Bharat Trader. Special thanks to him for developing this indicator.
Now, see the following examples. I am giving two examples – one is a right template to look for and other is a template to avoid :
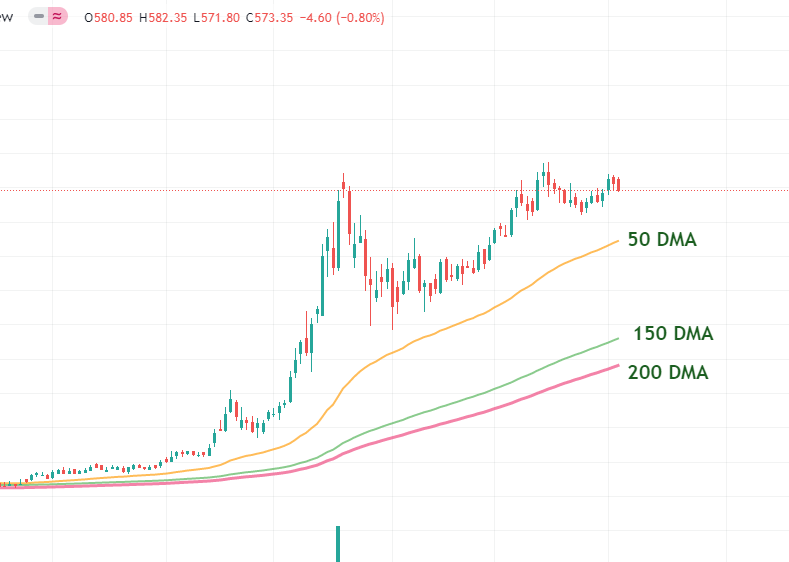
First Chart is of AMBUJA Cement – Daily Time Frame:
See how beautifully the moving averages are aligned as per the template. This shows the underlying momentum and also tells us that the stock is in an established trend. This stock should be in radar and one should wait for a proper low risk entry.
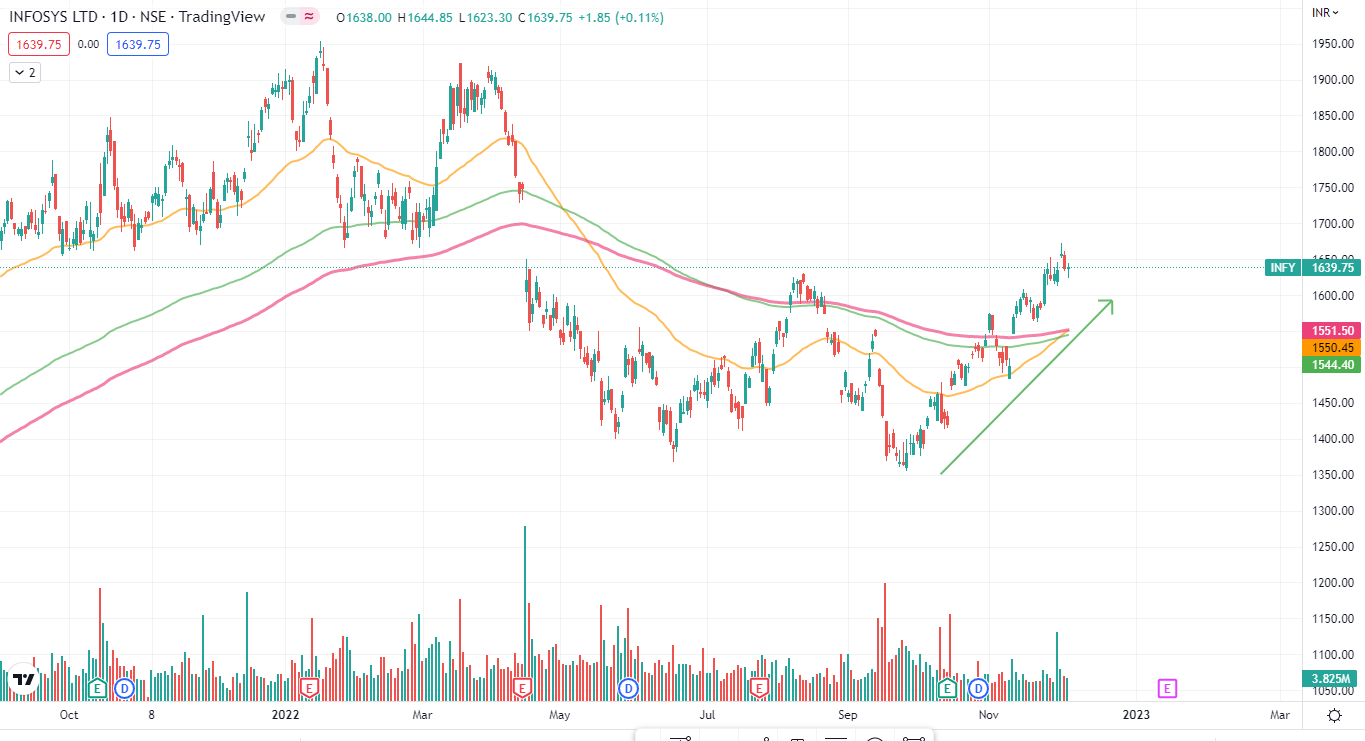
Now, see the chart of INFOSYS. Infosys is gathering a lot of attention now due to its recent momentum. Also, value buyers are loving this stock now as it is available at attractive valuations. If you are buying Infosys for long term investment, that is different. The scope of this article is about stock selection for short term and positional type of trading. So, as per the trend template this stock does not qualify our criteria:
You can see in the image below – Daily chart of Infosys – Though the price is above the 50 DMA, the alignment of moving averages are not in the order. Instead both the 50 DMA and 150 DMA are below the 200 DMA. This stock has to prove a lot before it comes to our watchlist.
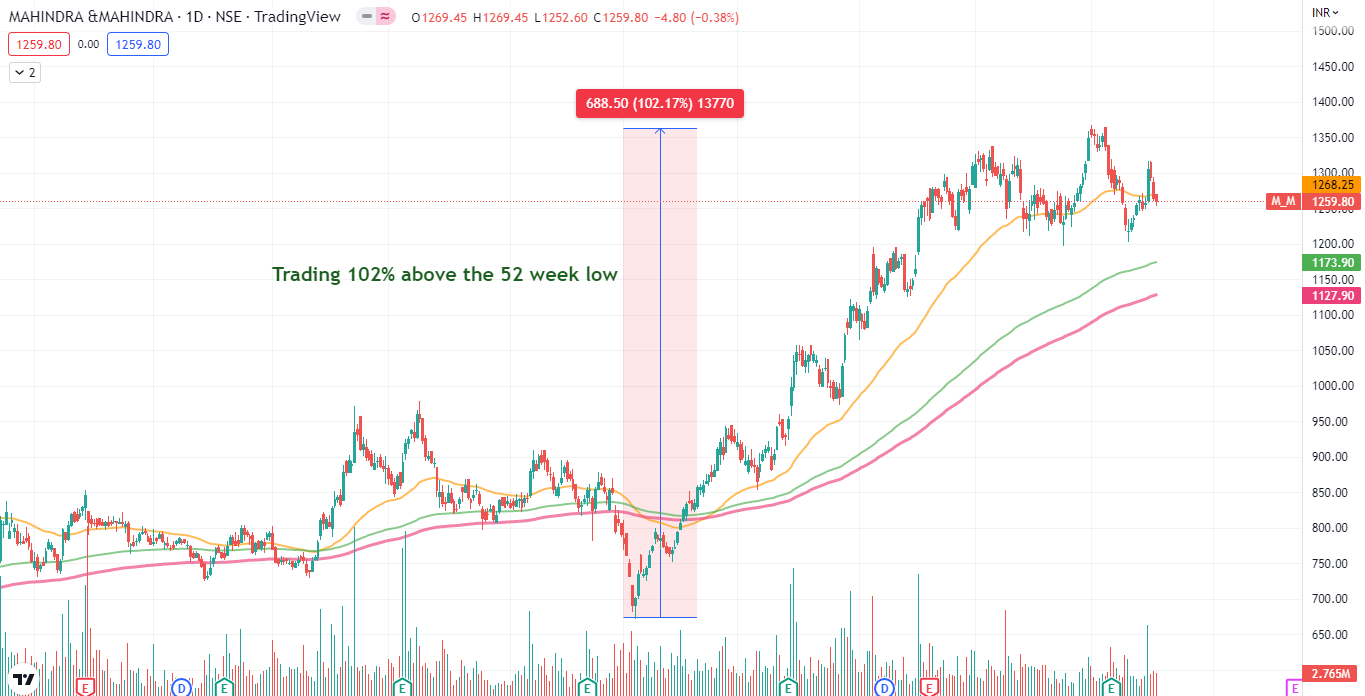
Current price of stock in relation to its 52 week low:
Mark believes in super-performance and he completely avoids stocks that are cheap. He never tries to catch the stock at the bottom nor waits to sell at the exact top. To make sure that his stock is a super-performer he emphasizes that it should be trading at least 25% above the 52 week high.
Some of the stocks can even be 100% or 300% high from its 52 week low.
As we saw Ambuja cements as an example above, let us see how far it is from the 52 Week low:
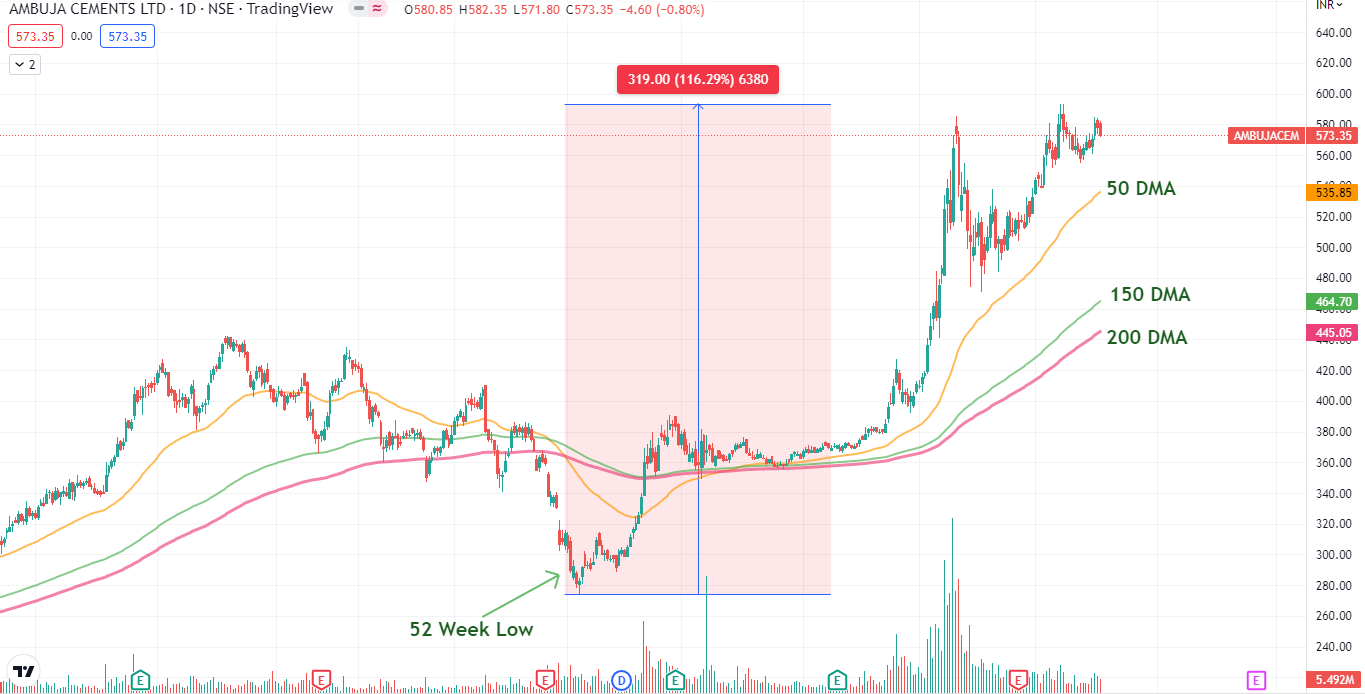
As you can see, the stock is trading 116% above from the 52 week low. See another example – Mahindra and Mahindra from Auto sector –
Please, note the stock names are just for educational case studies only. Not a recommendation:
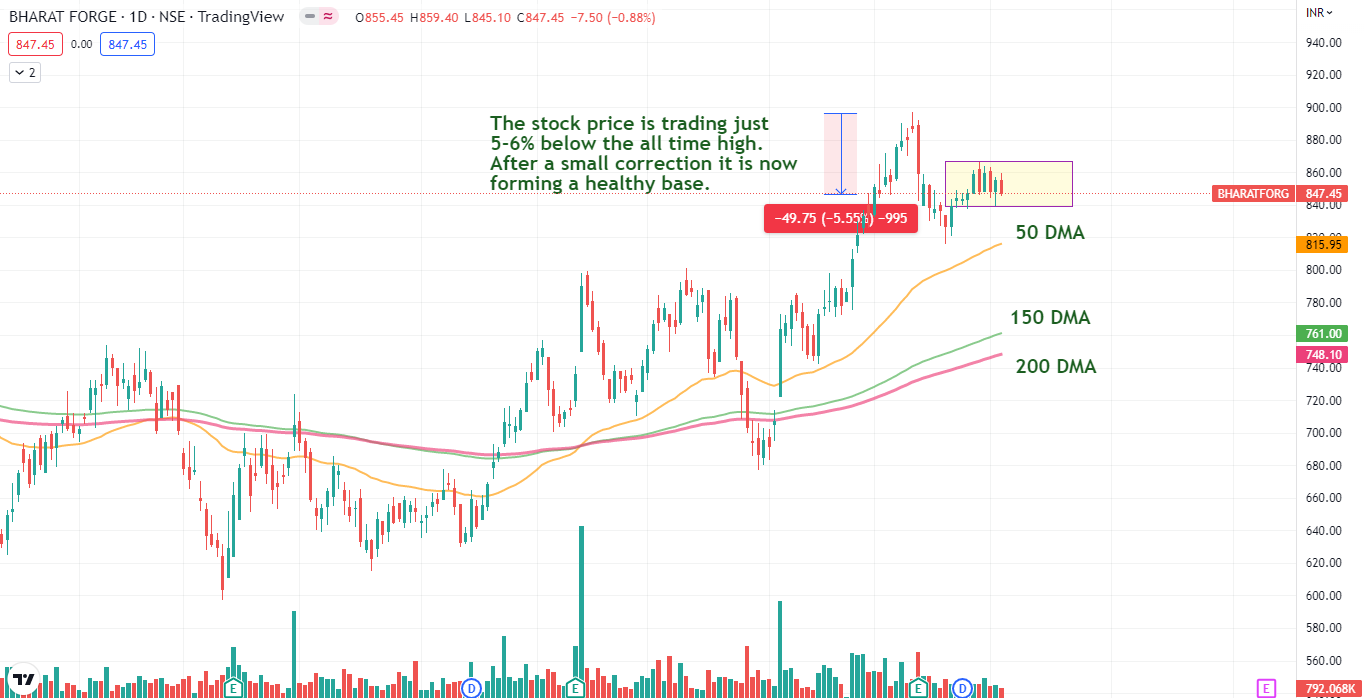
Current Price of stock in relation to ALL Time high:
Traders are usually averse of stocks trading at an all time high. It is human nature to think that the stock has run up too much and is very expensive. But, all time high stocks are the ones that are telling you how much strength they have. That too after a bear market correction, if you spot a stock that is trading at an all time high, then think of the potential the stock can do when the bull run starts.
Mark emphasizes that a stock should be in the range of at least 25% within the 52 week high. Mark avoids stocks that have corrected more than 50% from their all-time high. The closer the stock is near its all time high, more likely the super performance of the stock.
See the chart of Bhartforge in the image below – Daily chart:
Relative strength:
Successful traders never underestimate the relative outperformance of the stock to the market. Leading stocks tend to have tremendous relative strength. Relative strength ranking should be at least above 80 for a stock to get qualified. Now, how to find the relative strength rankings? It is available on the Marketsmith India website.
Just go to the site and search for the stock name and you will get the ranking of the stock. Below is the Daily chart of GESHIP and you can see that the RS rating of this stock is 89 (Red Arrow).
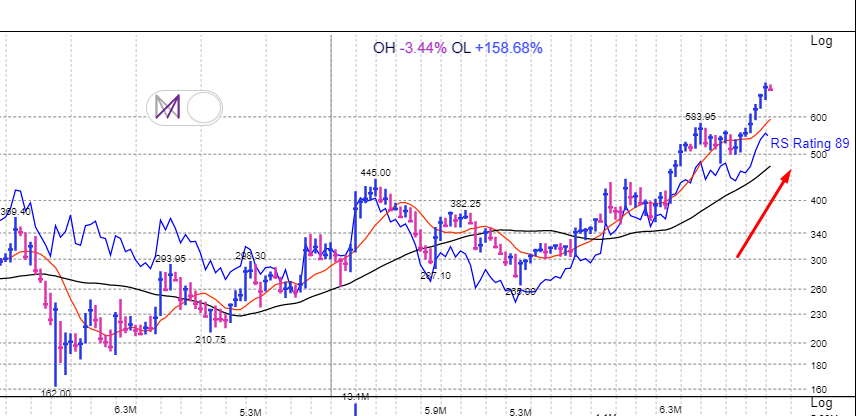
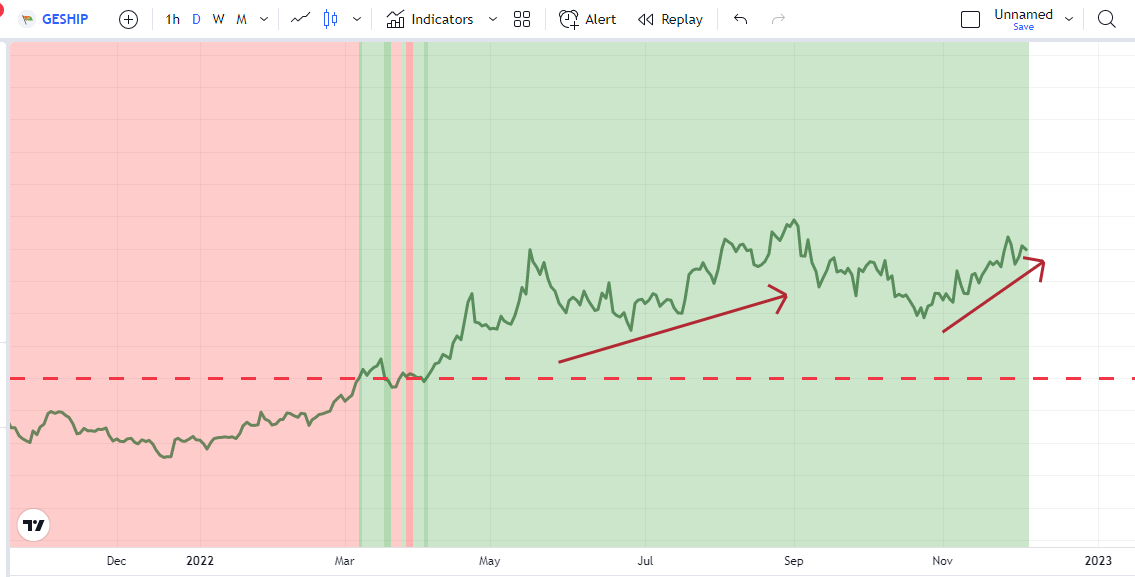
However, note that rather than rankings, I prefer seeing the relative strength line. A good relative strength line should be above the zero line and should not be in a strong downtrend.
The strength line should be at least, trending upwards for a period of six weeks. Note that these things are just guidelines and not a hard core rule. We can get the right stock if we keep on training our eyes. See the below image of GESHIP showing tremendous relative strength with the rising RS line trending upwards.
Scanning for Minervini’s Trend template using Chartink:
We all love scanners. Chartink is a wonderful website for retailers and it does a pretty good job in scanning stocks that meet certain pre-fixed criteria. There is one such scanner in Chartink that scans stocks with the Minervini Trend Template.
Thanks to the person who developed this scan. Unfortunately I can’t find his/her name to give the credit. I will share the link for the scanner here:
Minervini Trend Template – Chartlink Scanner
I am attaching the screenshot of the scan:
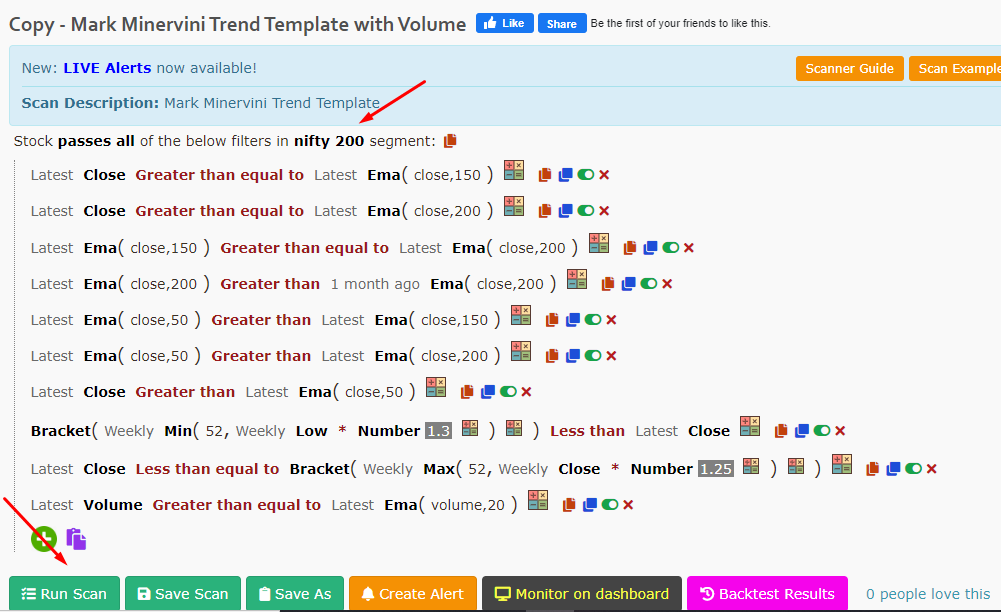
You can see from the above image, how the scan has been designed beautifully. Note that I had selected to scan the stocks only from the Nifty 200 universe (Red Arrow). You can choose your stock universe as per your wish.
It filters stock with the
- Correct moving average order = 50 DMA > 150 DMA > 200 DMA
- Price trading above the 50 DMA
- 200 DMA trending for at least 1 month
- Stock should be trading above at least 30% from the 52 week low
- Stock should be trading at 52 week high / All time high or within 25% from the high
- Volume should be greater than the last twenty days average volume (This criteria is not actually necessary)
Check the scan and look for the stocks that fulfill your selection criteria. Check the relative strength of the stocks. Wait for the stocks to pullback, form a base and then enter into it when it breaks out with proper position sizing.
Key Takeaways:
- Stock selection is an art and one should be very clear in the criteria they look up for selecting a stock to trade / invest.
- The trend trading template given by Mark Minervini is a tested and proven strategy to select winners from laggards.
- However, the math behind position sizing, the number of open positions you have in your portfolio and understanding the real significance of minimizing drawdowns are the key factors for consistent success.
- Also journal your trades the right way to understand your strengths and weaknesses.
- This stock selection works well from early stages of established broader market trends to mid-late stages of a matured trend. Remember that any leading stock that has given tremendous return has the ability to go down up to 80%. This is called Minervini’s 50/80 rule. So, trail your stop losses accordingly and protect your capital.
- Once the long term trend is too stretched or when one expects correction, the stock selection criteria should be adjusted a little, which I will be writing about in the third part of the “Art of stock selection” series.
If you like my writings, do share the article with your friends and on social media. Also, you can consider subscribing to the newsletter to get my insights delivered right into your inbox. Make sure that my mail reaches you in the primary inbox and not in the promotions tab. Happy investing !!!


6 thoughts on “Stock selection using Mark’s Trend Template – (Current market trends and Chart Examples)”