 by
by Hi all. Hope all are doing well. As traders, it is important for us to identify chart patterns which are usually associated with certain shapes like Cup and Handle, Triangles, Flags, Head and shoulder etc. Identifying these patterns helps in understanding the current price action and also helps us to pre-determine the future price actions.
I thought of writing a series of blog posts about different chart patterns and how one can use it to either enter into a new position or to add further into existing positions. I am planning to write one to two patterns per blog post so that I can give as many details as possible about the patterns.
I had already written two articles on “ How to select stocks in different market conditions “. If you had not read them yet, I would recommend reading them also, because that forms the basis of using these patterns effectively. Once the basic art of stock selection is over, we would have only a handful of stocks to focus upon and in those stocks it would be much easier to see these patterns.
But, if you are a trader who believes in a bottom up approach (stocks first market next) then you can directly start seeing the patterns from your watchlist.
In this article, I will be sharing my thoughts about a pattern which is basically a continuation of a bullish trend, when played properly can reap rewards. This pattern was first popularized by Wiiliam J O’Neil in his book “ How to make money in Stocks”. It is called the High tight flag pattern also called “Power play Pattern ” by Mark Minervini.
High Tight Flag Pattern:
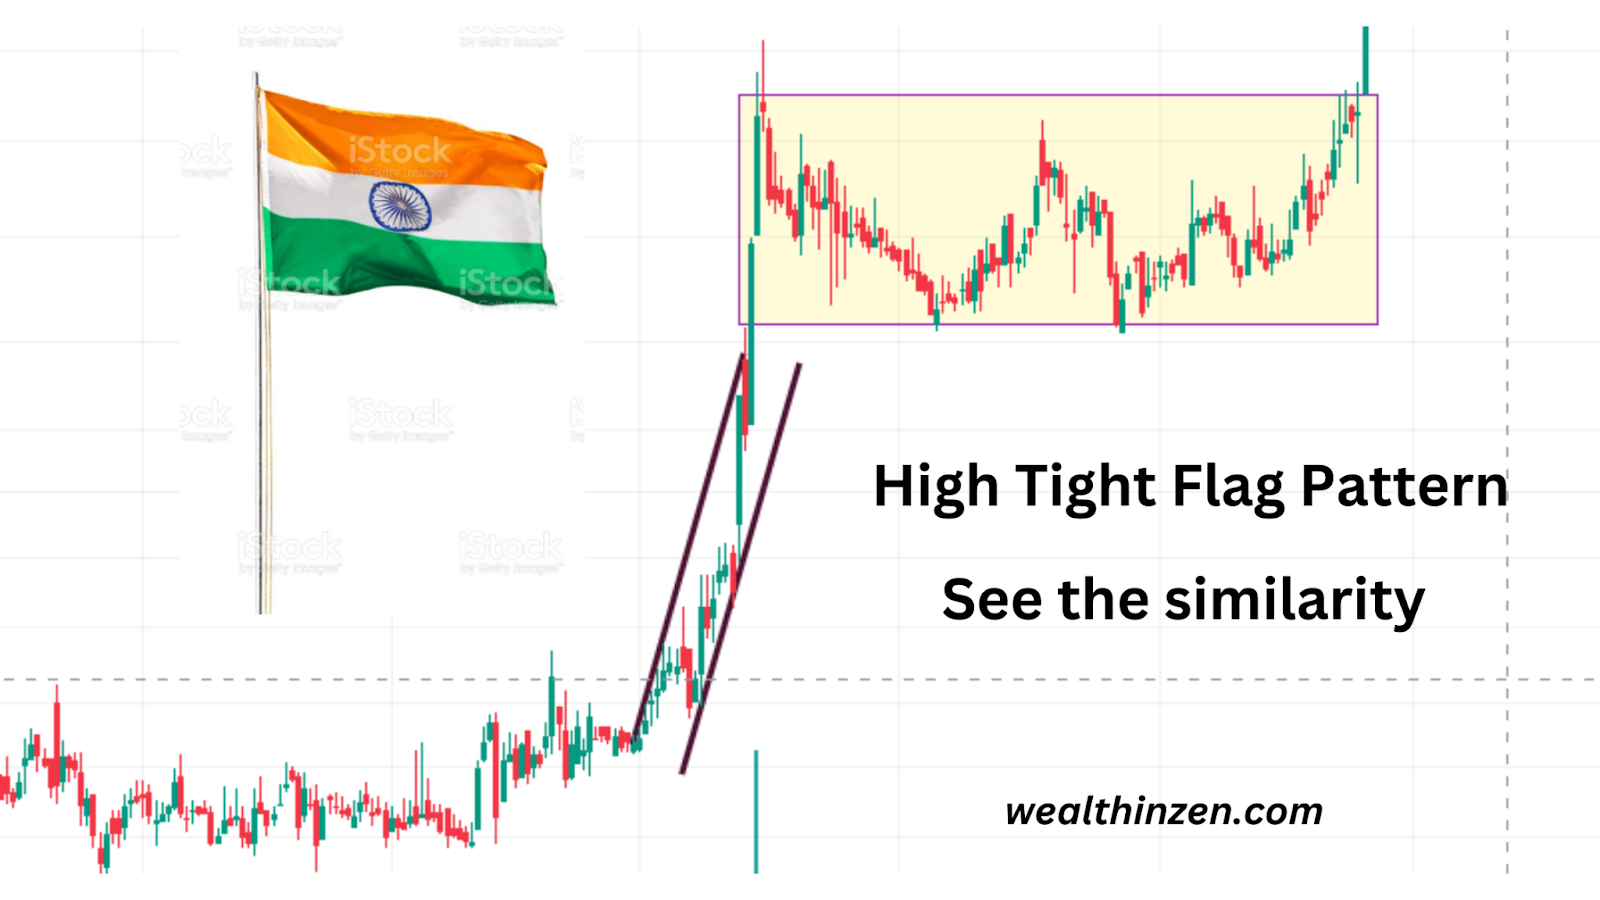
The name comes from the fact that the price action looks similar to that of a flag. Have you seen a flag hoisted when the wind is at full speed? You will see that the flag will be flying in a tight form without sliding down. This similarity has given this pattern the name.
The logic behind High Tight Flag (HTF) Pattern:
The logic is simple. It is based on momentum. What has moved up will continue to do so unless an external force/ stimulus acts on it. Similarly, when a stock moves tremendously in a very short time, the more likely thing to happen is, the stock will continue to move up.
Also, the move is so bullish that the price does not come down even after a recent strong uptrend indicating the fact that buyers are not ready to sell the stock any time sooner and expecting the stock to rise further. The price tends to remain in a tight range, indicating a strong fight between the buyers and sellers.
This bullishness and the tight range is such that when the price breaks out of the range the stock has the high probability to rise in an explosive manner. It also allows the trader to keep a tight stop loss since the price action is itself a tight range bound.
The stock criteria:
Now, let us see which stocks will come under the criteria of High Tight Flag pattern:
Stock Recent Price move:
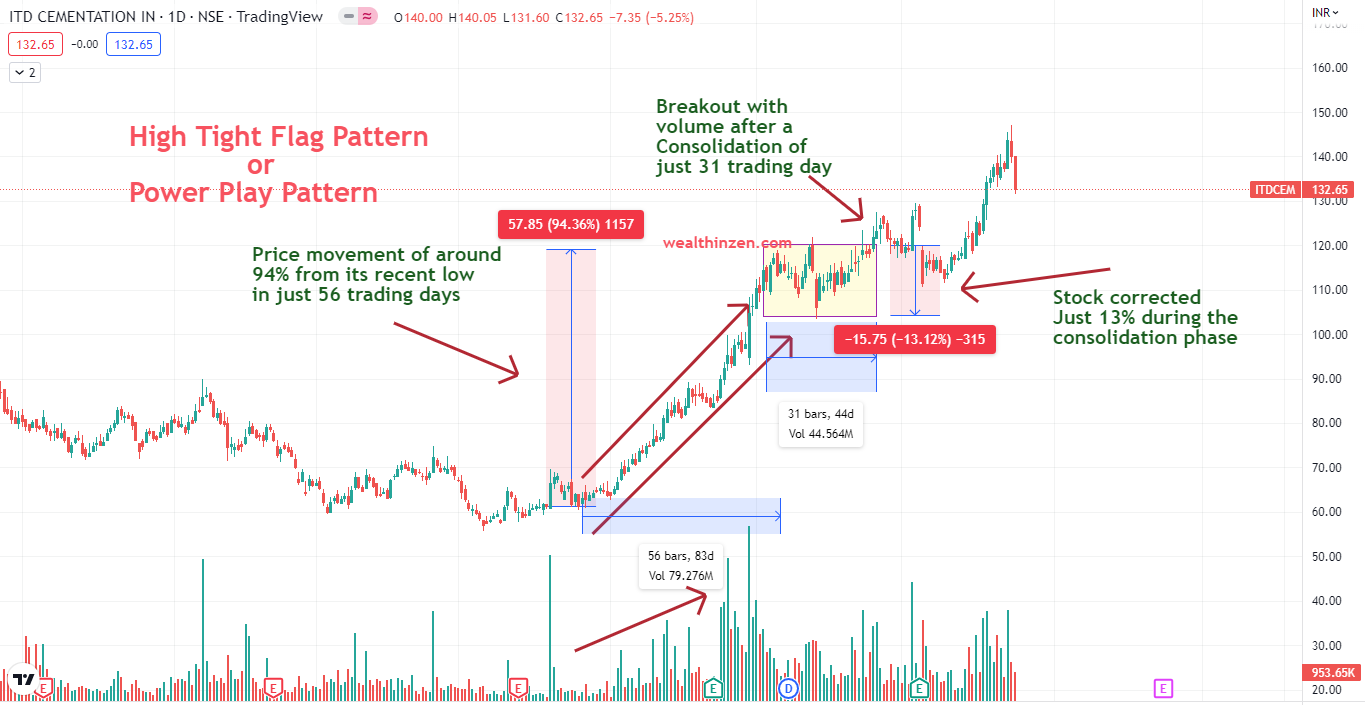
The stock should have moved at least 90% from its recent low. Some stocks may have moved even more than that, like 200-300% also. This generally makes a trader feel nervous and most traders will be hesitant to enter here. However a trader with a perfect plan will do it in the most perfect way possible.
Time period:
The move should have come in a very short period of time, that is less than eight weeks. This is just to make sure that the stock has strong momentum and high buyer’s interest.
Price correction during Consolidation:
Once the up move criteria as said above is met, next is the price action during the consolidation period. The price should correct very less during the period of consolidation / sideways movement. The price correction should be less than 20-25%. Lesser the correction, the stronger the pattern.
Time period of consolidation:
Now, the next thing is how long does the consolidation play before the breakout happens. Usually a period of 3-6 weeks is considered to be good. This approximates to 15-30 days of consolidation.
A longer period of consolidation say for 10-14 weeks is not recommended as it reduces the buyer’s interest and it also signifies the loss of momentum. However, this point applies to you only if you are a very short term type of trader say 2-3 weeks trader. If you are a longer time frame trader, then this is actually a good sign.
One thing to note is, once the price breaks out after a long consolidation period, the impatient traders that were trapped during the consolidation phase start to book out profits. This slows down the stock price movement a little. If you have the patience to wait out and allow the structure to develop then you will be rewarded enough by the market.
See the image below:
An example chart showing the High tight flag pattern:
This is a daily chart of ITD Cementation. Showing all the characteristics of High Tight Flag:
Note: One thing to note is, don’t be too rigid on the textbook patterns or the criteria. If the stock market plays in the exact text book way then, AI (Artificial intelligence) like Algo trading would have replaced everything. So, be flexible. Just understand the concept behind it and go behind what you feel as worth trading.
How to trade the HTF (High Tight Flag) Pattern?
Entry:
Never attempt to pre-empt the trade, even when the structure is highly appealing to you. Don’t get tempted before the consolidation phase starts and then wait till the breakout happens after consolidation.
Things to look:
All the above said criteria along with good volume while breaking out. Also look for the proper alignment of Moving averages that is 50 DMA > 150 DMA > 200 DMA. I had written an article on stock selection with this trend template by Mark Minervini. Read it if you are interested.
Look for good relative strength when the stock breaks out. RS Line should be in the positive zone.
Stop – Loss:
SL should be kept depending on the timeframe you are trading. This article focuses on the daily time frame. So, the SL can be kept at the lowest point of tight range.
If you are playing the same pattern on a weekly or monthly basis, keep the stop loss at the lowest point of breakout candle. This way you will know whether the stock is going to perform or not relatively quicker.
How to find High Tight Flag Pattern?:
I searched for a readymade screener However, all the screeners available are not that much sophisticated and hence you may miss some really good stocks.
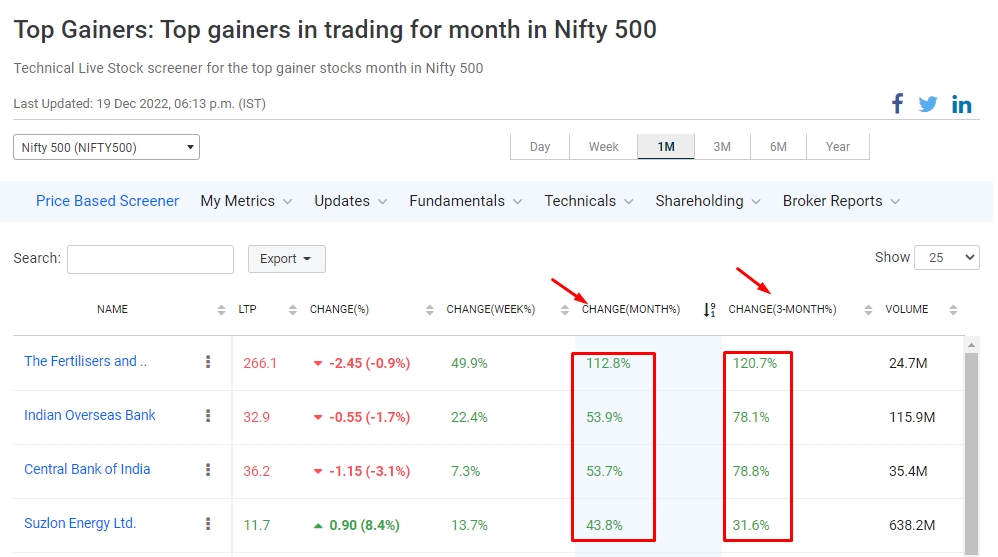
However, I have found a website called Trendlyne. In this website you can filter stocks that have given returns around 60-90% within a month or three. Then you can start seeing the stocks. I personally limit my stock universe to Nifty 500. Any stock I select should be at least in the Nifty 500. This gives me good liquidity and the price actions are also reliable.
Here is the screenshot of the filtered stocks. Kindly make sure that these are for educational purposes only and not a recommendation.
Current and Recent Examples:
Let us see some of the recent HTF Patterns that played in our Indian stocks. Please note that the price actions of some of these stocks have played out some days ago. So the current price action might be different.
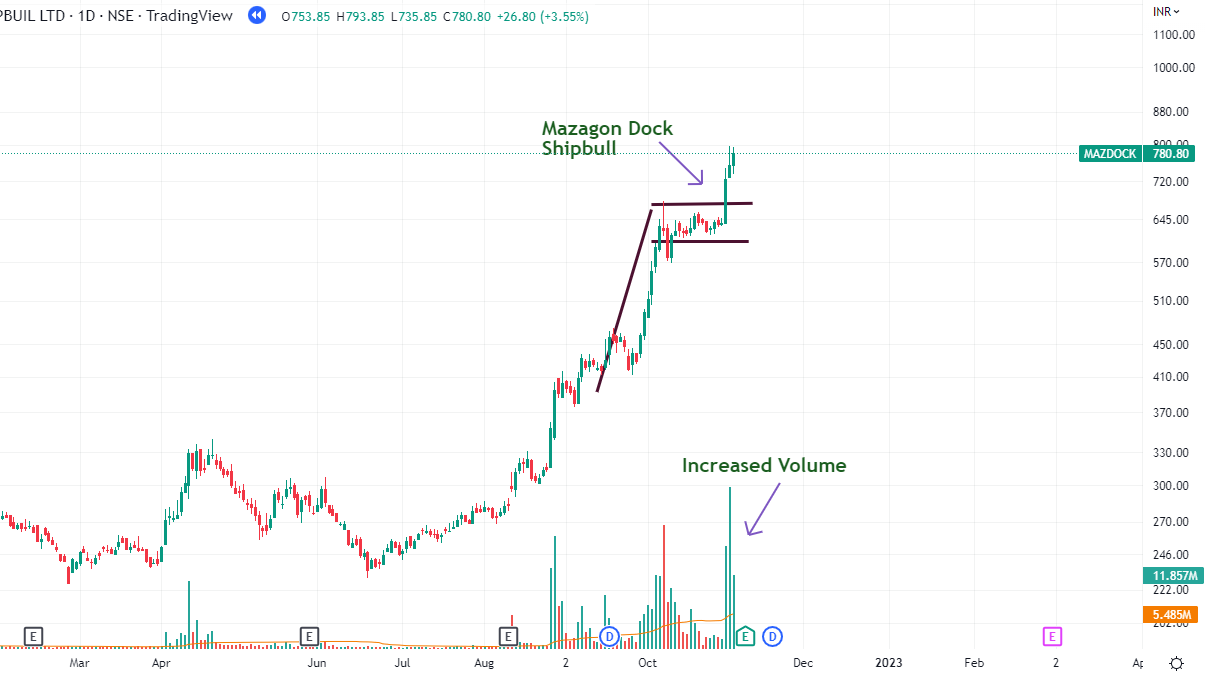
- Mazagon Dock Shipbull LTD
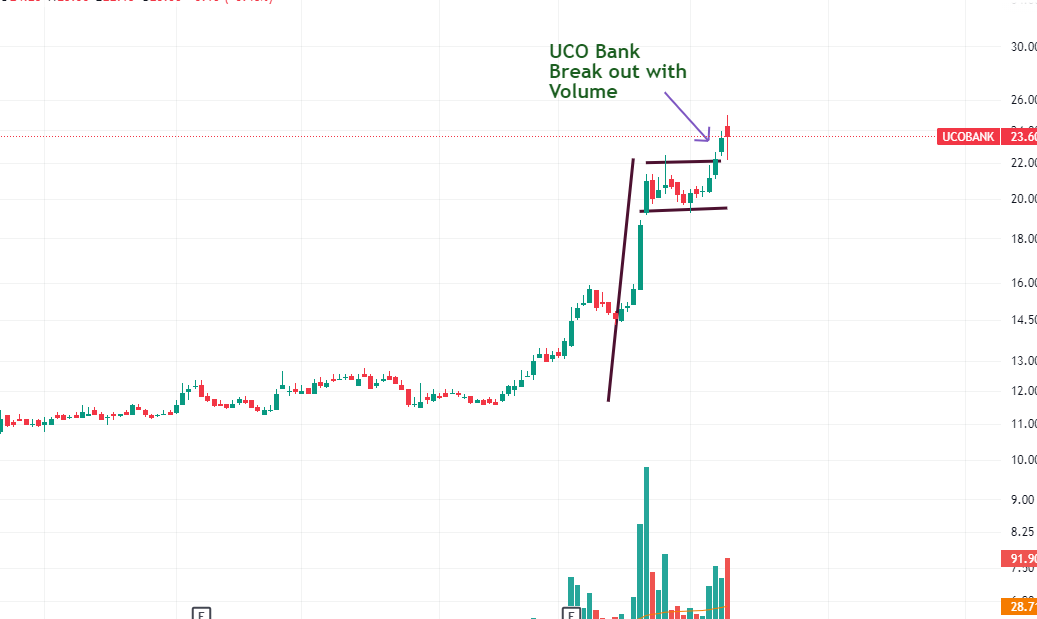
- UCO Bank:
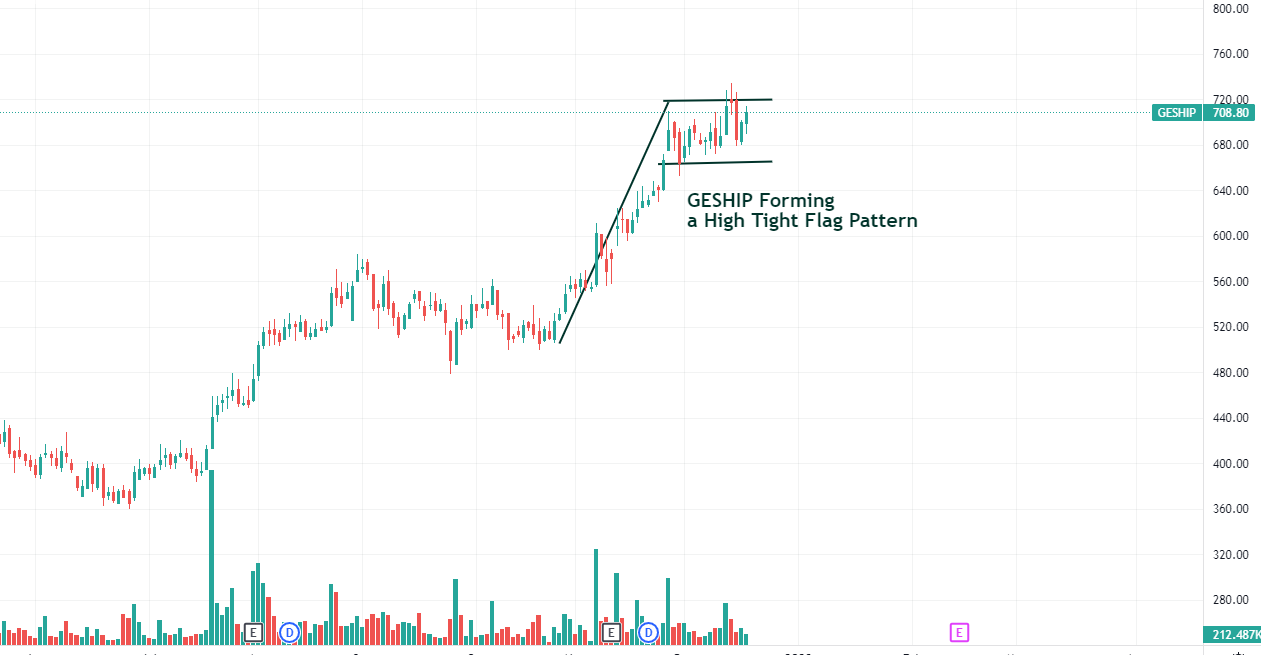
- GESHIP: The stock is developing flag pattern after a rapid move:
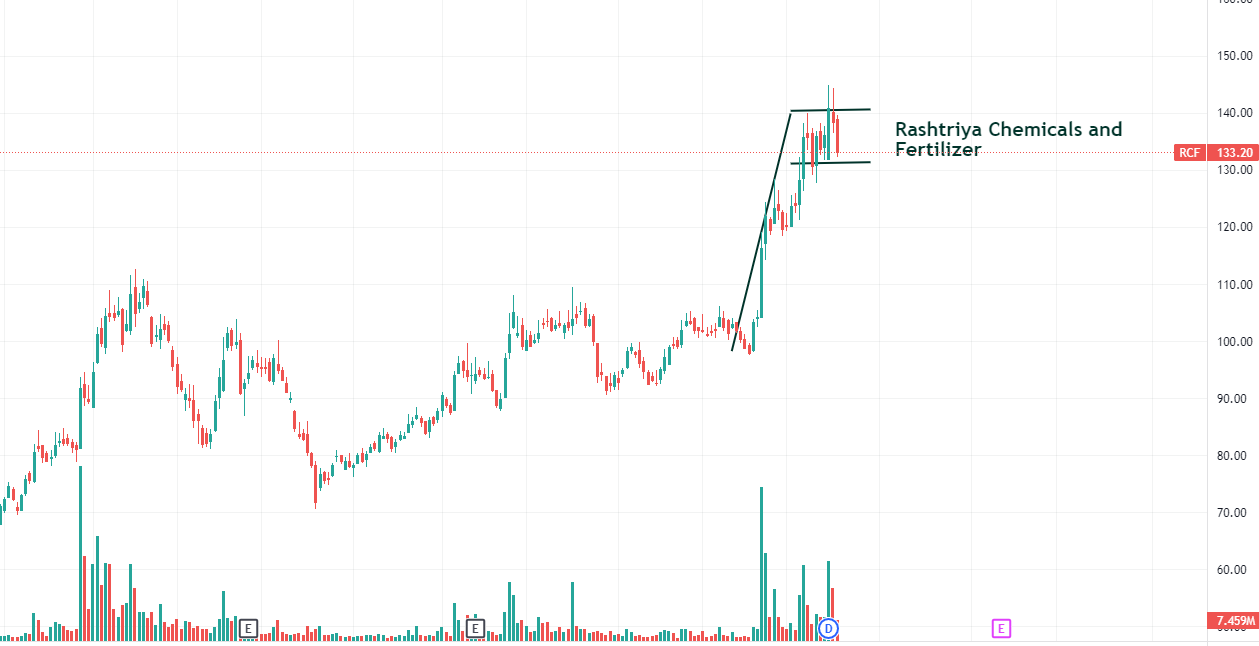
- Rashtriya Chemicals: This is also developing the same pattern:
Things to note:
HTF pattern is highly effective when the broader market conditions are super bullish. Without the underlying current this pattern may fail repeatedly and SL will be hit often. Always keep track of the broader market with these five key data points.
Always, select stocks that are already in a fantastic momentum and a clear stage two. You can read my article on how to select stocks in stage 2 by using Mark’s trend template for further details.
Position size your trades properly and play with proper risk management rules. Keep your open positions limited to see considerable success in your trading career.
Also, track all your trades and make note of which strategy is giving you good returns consistently and which strategy is appealing to you. Make a perfect trading journal and track it for free.
This pattern is highly successful, when the broader market is just recovering from a bear market or in the early stages of a bull market. That’s where you can take considerable positions and you can expect a better risk reward ratio. If the trend of the broader market has matured considerably, then wait for a reasonable pullback and then look for stocks forming HTF patterns.
If you like my writings, kindly consider sharing my article with your friends / social media and you can also follow me on twitter. Also, consider subscribing to my newsletters so that you can get my insights delivered right into your inbox.
Thanks for reading and you can always write to me at [email protected] for feedback and suggestions. Happy Investing !!!
2 thoughts on “High Tight Flag Pattern: (Never miss this explosive Trading Set up – Power Play Pattern)”