
 by
by The Nifty has fallen to 15-20 % from its high in recent days and people are screaming that the bulls have lost their grip, recession is coming, secular bear market has started and what not. Panic is there everywhere and it is understandable.
If you have started your investing journey after the Covid fall and invested even with very simple logic, your portfolio would have reached at least 30-50% of gain. Though your portfolio returns would have been in green till the Nifty made its all time high, this 15-20% fall would have wiped all your portfolio’s profit and it will be in red now. Have you ever wondered why my 40% gain of portfolio has not been able to bear the 15-20 % fall of nifty? That is the wonder of math and that is why you should be aware of drawdowns in your portfolio as a whole.
In this article, I will share my thoughts about how drawdowns are usually overlooked, how it affects our overall portfolio health, how one should take note of it to be a consistent winner and to protect our profits.
What is a drawdown?
Before moving on to the discussion, I would like to give a brief intro about the drawdown, so that it will be easier for new beginners to understand. A drawdown is considered to be the fall of an index / stock / portfolio from its recent all time high to the lowest point.
See the image below from Tradingview:
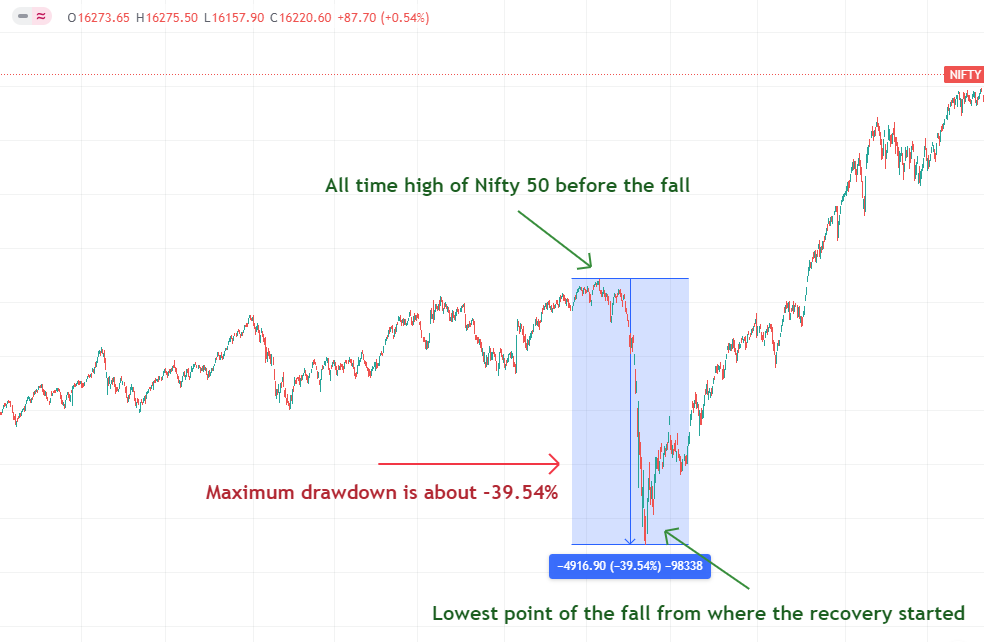
The chart is of nifty 50 from the period 2018 to 2021. You can see that after reaching an All time high 12430 it fell to a level of 7511, from where it started to recover to reach a new all time high. This fall is about 39.54% and it is the greatest fall in that time period. This is called “Maximum Drawdown”.
Lesser the drawdown lesser is the loss and hence it is important for us to keep our drawdowns as minimum as possible.
Understanding the math behind drawdown:
We all would have taken trades in the recent bull market and many of us would have been in a trade which would have given us more than 100% gain. However, do you know how much drawdown would be required to wipe off your 100% gain? Just 50% drawdown will wipe off your 100% gain. Similarly, a 75% gain will be wiped off by 42% drawdown.
See the below chart:
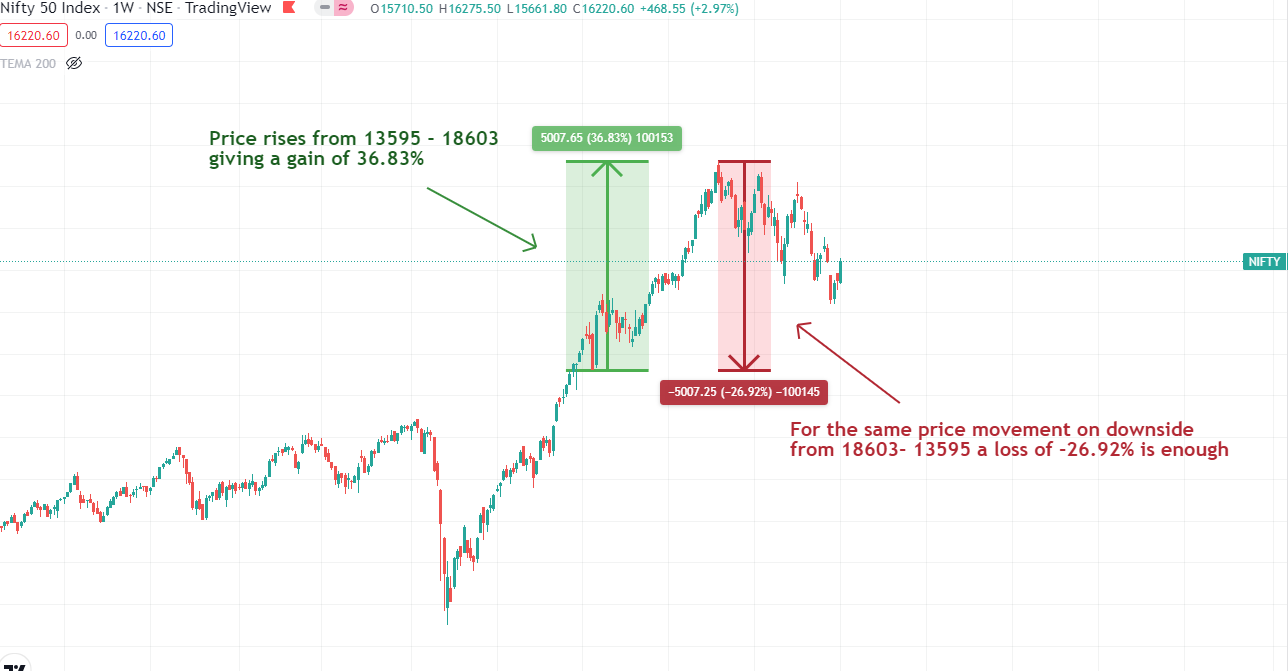
In the above chart the price movements are same for up move and down move- that is around 5007 points (From 13595 – 18603). However, the percentage of gain and loss varies for the same price movement. While during an up move it gives a profit of 36.83% on down move it requires just 26.92% to reach that low price.
Why is it so? This is because in an up move the % of gain is calculated from its entry point that is 13595. To reach 18603 from 13595 it requires a gain of 36.83%. However, in down move the % of loss is calculated for the entire value of 18603. So, 26.92% of 18603 is 13595. Now, it will be clear to us why there is so much panic in a down move of even 15-20% in an index/ stock or a portfolio.
Recovering from the drawdown : Time and percentage needed to breakeven
Because of the difference in calculations as said above, the % of gain for recovering from a drawdown differs significantly. And hence the time taken for recovery from drawdown also varies a lot.
See the below image:

You can see that a drawdown of 5% requires just 5.26% gain to breakeven. However as the drawdown increases greatly, the % of gain needed to breakeven becomes higher and higher. For a drawdown of 90% you need a gain of 900% to just breakeven. How many of us are confident or would have been in trades that give 900% every now and then? Even if we get a trade that gives 900%, what would be the time taken to get that? How many of us will have the confidence to sit patiently till that time?
Thus, reducing the drawdown is very important if we wish to be a successful and consistent trader/ investor in the long run.
How to keep track of drawdowns of a particular fund?
If you are investing in a mutual fund it is wise to compare how much of drawdown your fund has witnessed in the past by comparing it with the category benchmark and Index. Some financial websites like Morningstar give us insights about the drawdowns. You can see in the image below. This is a comparison of SBI Small cap mutual fund Direct Growth plan with the benchmark categories. You can see that in the last 5 year period, while the drawdown of the fund is just -33.04% (Blue rectangle), the drawdowns of the category index is very high (-41.53% and Index -48.84%).
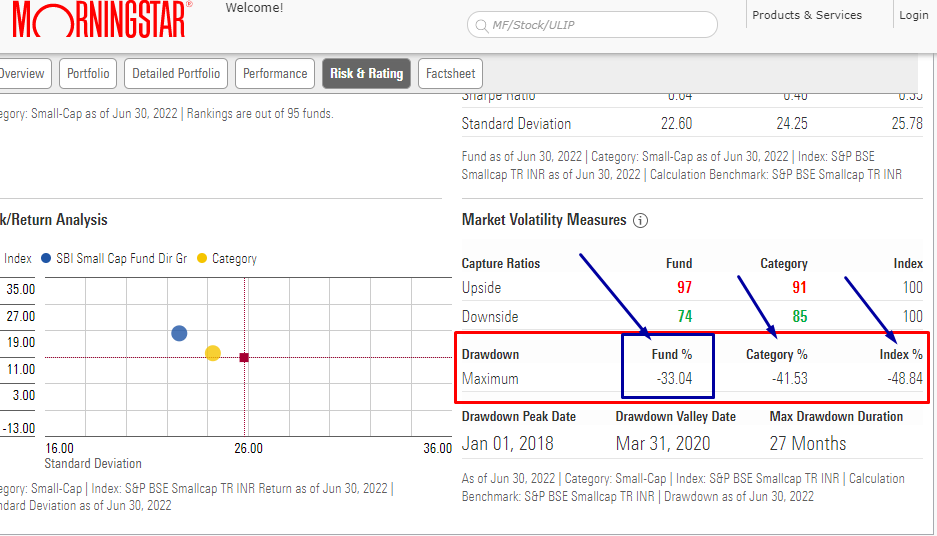
This indicates that the fund has performed better than the respective index and the fund manager has done reasonably well in the past.
Maximum drawdowns of Index Vs Your Portfolio :
However, if you are an active investor and invest directly in stocks it may be difficult for you to track the drawdowns. But, I will share a method which I use for tracking my portfolio. When tracking drawdowns you should track it on a portfolio basis and not on individual stocks. This is because the drawdown of a stock will more likely be greater than the benchmark index you are comparing. In other words, stock may fall easily 40% down in a short duration and again rise to 100%. But, index fall will not be that erratic as it is a combination of multiple stocks.
So, how to do this? I usually compare my portfolio with the Nifty index. For that I use Niftybees valuations.
Every week I note down my current portfolio value and the corresponding Niftybees value in an excel. You can do it monthly once also if you don’t have enough time.
See the image below. This is how I do it. I do it every Friday after the market closes. My current values are noted from my broker account. I assume that I also buy nifty bees for the same amount on that day. (Remember, this is an imaginary purchase).
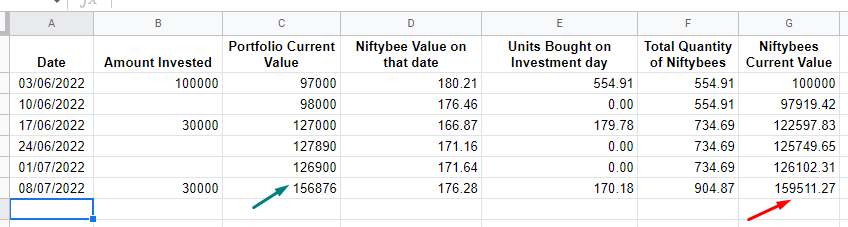
In the above image, you can see that I invest 1 Lakh (all values are for illustrative purpose only) in nifty bees as an assumption. The price of nifty bees on that day is 180.21 per unit. So, for 1 Lakh I would have purchased 554.91 units. After two weeks on 10/06/2022- I invested 30000 in my portfolio. Correspondingly, I assume that I purchase nifty bees for the same amount. The price of nifty bees on that day was 166.87. So, I would have purchased 30000 / 166.87 = 179.98 units on that day. So, my total units of nifty bees becomes 734.69 (Initial 554.91 + 179.98). Now, the current value of nifty bees is calculated by multiplying the total units in hand (734.69) with the current price on that day (166.87) = 122597.83.
Repeat this, for every week. (If you sell your stocks for 50,000 value then sell nifty bees also for the same amount). After a year or so, you will have ample data to see how your portfolio is performing compared to the Index.
From the two data columns – Current value of portfolio and Current value of Nifty Bees you can see how much your portfolio has fluctuated and the maximum drawdown of these two. If your portfolio’s drawdown is lesser than the Nifty Bees portfolio, then you are doing fantastic. If not, review your portfolio.
For those who are interested in calculating drawdowns by using excel can watch this youtube video here: https://www.youtube.com/watch?v=pPiLxPqz3Ds
Conclusion :
Now, we have seen how a drawdown can affect our portfolio and it is very important to limit the drawdowns. Limiting drawdown itself will boost our portfolio returns to a great extent.
To limit the drawdown we should have a clear strategy of when to exit positions. We also should have a proper position sizing of our portfolio. If you want to know how to position size your trades you can check out my article here.
Any Strategic stop losses that are based on RS, Long term pivot bases, Moving averages, Momentum etc, can work. But, you have to ask yourself which system is better for you and stick to that system for the long term. Also, when time arises never hesitate to follow your processes and fearlessly execute your game plan.
Key Takeaways:
- Drawdowns have to be limited to achieve consistent success in the stock market.
- More the drawdown, more time required for recovery and the returns needed to breakeven increases geometrically.
- Keep a track of your portfolio and compare the drawdowns during market corrections as said above. In this way you can evaluate how your portfolio is performing compared to the benchmark index.
- Position sizing plays a very important role in reducing the drawdowns, even in case of worst case scenarios.


12 thoughts on “Understanding the real importance of Drawdowns – (Be a consistent winner in stock market) ”