 by
by Deploying a large chunk of money in the stock market in one go can be a nightmare for many of us. What if the market starts spiraling down from tomorrow after we invest the money? Timing the sector and timing the market has proven to be effective in compounding our money. But is there a better way to time our investments?
As our capital grows along with our knowledge in the stock market, we should have the plan and guts to invest in lump sum amounts without making blunders.
Assessing the strength of the market at the time of our lump sum investment will give us a better understanding of what may come up in the future. One such way to gauge the overall market health is by assessing the market breadth. There are several ways to assess the market breadth. In this article, I will share my thoughts on one such tool called the “200 Day index”. We will see how one can use that to time the market using this and how you can keep track of this tool by just spending two -three minutes a day.
Market breadth and 200 Day Moving Average:
Market breadth is nothing but a measure of how many stocks are participating in the move of a particular Index / Sector at that point of time. The index may be moving higher day by day but still the participation of stocks in that index may be decreasing. This is because the index is a market cap weighted. Five to seven stocks with greater market weight determine the move of the index greater than the small weighted stocks.
Market breadth can be determined by various factors like Advance / decline line, 52 week high- Low, Bullish breakouts etc,. The one we are going to discuss here is about the percentage of stocks that are above the 200 day moving average at any given point of time. This is a market breadth indicator which ranges between 0-100% depending on the percentage of stocks above the 200 day moving average.
See the image below:
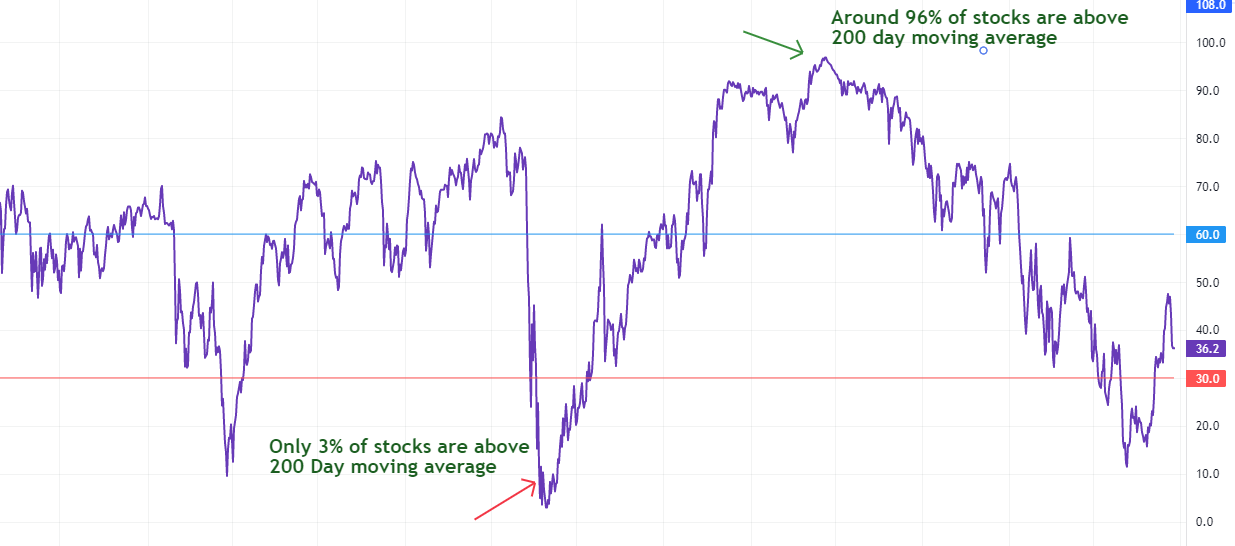
The indicator ranges between 0-100. As of March 2020 (Covid crash) only 3% of stocks were above the 200 day MA (Red arrow) and as of April 2021 about 96% of stocks in S&P 500 US index were above the 200 day MA (Green arrow). Let us dive deeper.
Significance of 200 day Index:
One may wonder what is the significance of tracking the percentage of stocks in a given index that is trading above its 200 day moving average. Any trader / investor will be sure of the fact that if he is long in a stock, it should be above its 200 day moving average. Hope we all agree with this point. In this article I am going to take the S & P 500 US index as an example for explaining my points.
So, imagine if in the S&P 500 index, 90% of its stocks are above the 200 day moving average. What does it imply? It implies that the market is in a bull run. However, does it mean that you can deploy your new investments now? No. But WHY??
Markets move in up and down motion like a wave and never go up in a linear fashion. Mean reversal is a very common phenomenon of the stock market or any other market in the world. The price comes to mean (here it is 200 day MA) frequently, consolidates and then continues to move forward. Investing our new money at the time when everything looks super bullish is not a wise idea from a risk reward point of view. Also, it will impact our position sizing.
We should wait for the heat to settle down and it is better to invest new money when the 200 day index is between 30-50% levels.
Logic behind the 200 day index:
When almost 90-95% of stocks are trading above 200 day MA, it is a sign that the bull market is getting mature. Every stock you pick irrespective of its fundamental value rises. Bull run starts with pessimism and ends with euphoria. There is too much froth build up when almost all the stocks are trading above the 200 day moving average.
This is the time when the retailer and non professionals will bring their large chunk of money thinking that we are going to miss out. The fear of missing out kicks in and the retailers bring their hard earned money into the market. The Media will be explaining how this bull run is going to continue and how soon the Nifty is going to touch 50000. All things will be rosy. New investor after investing for a week and seeing his profits brings in more money. Some even borrow to put money in.
When the retailers start investing like crazy, professionals and institutional players become cautious and slowly take out their bets. Investing money at this time is similar to boarding on a train that is running at full speed. You are bound to get hurt.
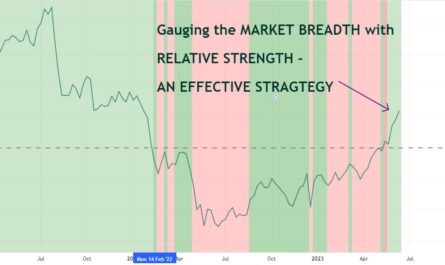
See the image below:
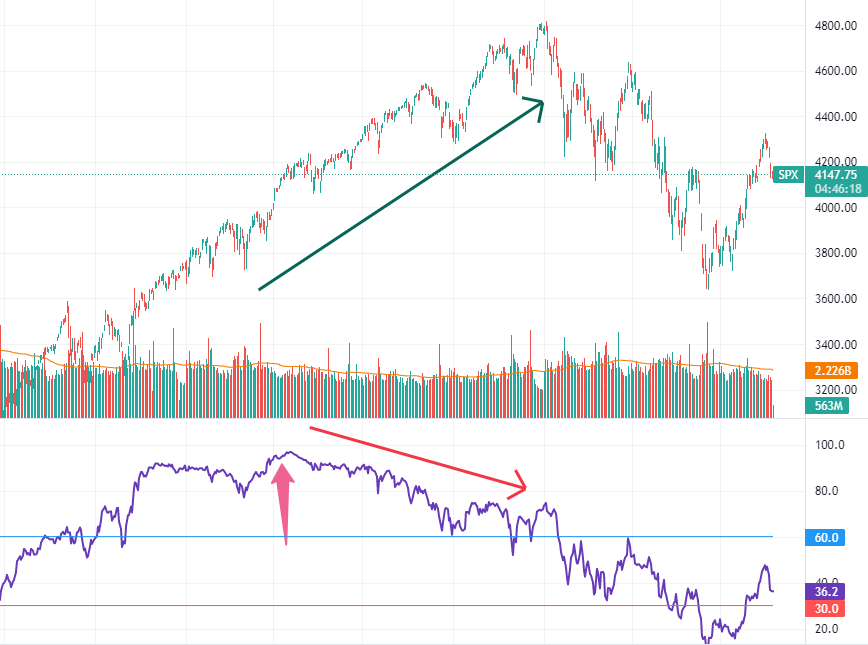
In the above image, the upper half represents the S&P 500 US index and the lower half represents the 200 day index market breadth. As you can see the indicator reached its top in April 2021 (Pink thick arrow). At that time around 96% of the stocks were trading above 200 Day MA. After that the indicator started dropping (Red arrow).
However, even though the indicator started dropping, note that the index continued to rise till Jan 2022 (Green arrow).
This is because of two reasons:
One reason is, since index is weighted based on market capitalization, the large cap stocks would have been doing better while the small cap stocks and mid caps will be getting beaten out.
Another reason may be because the professionals / institutional players will be slowly distributing their positions to the greed driven maniac retailers and will be booking profits.
In the above image you can clearly see the negative divergence between the Index and the market breadth. A clear sign of warning !!!
Tracking 200 day Index:
So, now we have seen the logic behind this indicator. Now, how to track it? Tracking should be done on a daily basis. The above indicator is called “ Market breadth Percentage of stocks above MA of various indexes” by tow T.
It is available in Trading view as a free indicator. However, it is for S&P 500 US stocks. For us we need to track the Nifty 500 index. This is available on some paid sites like Definedge.
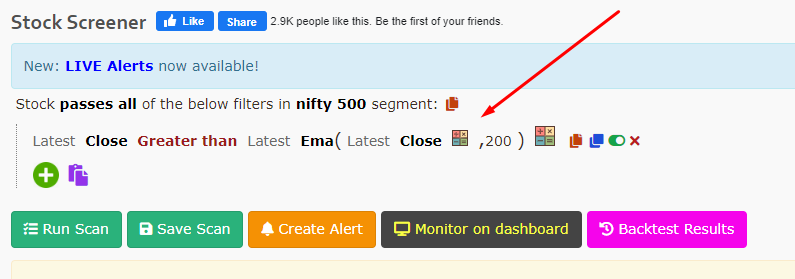
But wait, if you are willing to spend two to three minutes a day, you can do it manually for free. Chartink is a screening site where we can scan stocks based on our criteria. Just go to Chartink and then use the following formula as shown in the below picture (red arrow). This screens the number of stocks that are above 200 day Moving Average (MA) at the end of the day. If you don’t know how to use chartink scans just see some youtube videos and you will be fine.
Once you run the scan, and at the end of the page you can see the net filtered results.
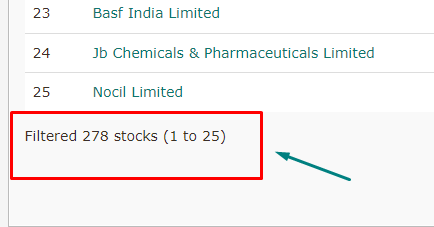
So, as on August 24 – 2022, the number of stocks in the Nifty 500 that are trading above the 200 day MA is 278. When converted to percentage it is 55.6% approximately. Do it daily for two to three months from today and you will have a reasonable amount of data to plot as a chart in excel. This is how I do it now.
(If any of our readers is a coder and can write a code for this, in the trading view, kindly let me know, so that I can link that in this article. It will be of great help to the retailers).
Limitations:
This indicator works fantastic in extreme bull runs, however when the markets consolidate or when the markets move slowly, market breadth may also remain in range for a longer period of days. For example, it is best said to bring in money when the indicator is at an oversold zone like 10-20%. However, when the markets are moving slowly but steadily you may miss a major move that happens overtime. The indicator may remain in the 60-70% zone for longer periods but the index can be moving steadily. Waiting patiently in those times for the market to settle down will be frustrating at times.
This indicator should be used in conjunction with other market views and price actions. Please refrain from using this indicator as some magic formula. You will be in a soup for sure.
The indicator is useful for people who invest in a lump sum manner and for active investors who know what they are doing. If you are a beginner and doing your investments in SIP mode, then don’t make the blunder of waiting for perfect time to invest. For SIP transactions the best day to invest is today. Timing the market for SIP investments will be very costly and tiring. (Read my articles on SIPs)
Key Takeaways:
- Timing the market is possible in many ways of which this 200 day index is one of them.
- Understanding the market breadth helps us to be informed about the future direction of the market.
- It also helps us to avoid severe drawdowns in our portfolio.
- When the market is moving higher and higher be cautious when there is a negative divergence between the index and the indicator.
- This indicator should be used in combination of price action and other market views and not as a standalone magic indicator.