
 by
by Most of us know that there is no holy grail in the stock market. However, have we stopped searching for one? The answer is definitely “NO”. Though we know that there is no holy grail we keep on searching for one and in the process we gain much deeper knowledge about the stock market itself. But, if there should be one thing that comes close to the holy grail in our investing success it is the “Position Sizing”.
Ask any top performing trader /investor he/she will be very clear about their positions and what they will be doing in case everything goes against their decision. Here, by positions I mean determining – how much stocks to buy, how much should one invest in each trade, how much should be one’s stop loss, how much will one lose in case of any black swan event.
In my previous article, I had discussed various position sizing strategies / models and had concluded that the percentage model is much more reliable and successful. However, I felt that I had missed some very important points in concluding so. In this article, I will try my best to explain why I prefer position sizing based on percentages and how one can use them to their trading success.
The unknown facts of Coin toss theory:
Most trading books talk about the coin toss theory. For those who don’t know, it is nothing but a game of probability. Imagine a coin is tossed, the probability of getting a Head is 50% and the probability of getting a Tail is also 50%. Now, in case each time the head shows up the tosser gets two coins (Profits) and each time the tail shows up loses one coin (Loss). By this logic the loss is small and the profit is big. Loss/Profit ration is at a ratio of 1:2 and hence, even if the tosser loses 50% of time he will end up having more coins (profits).
Though this theory is true and is proven, there are some deeper aspects to this theory that has to be understood. This 1:2 profit/Loss ratio is widely known and popular that almost all traders know that. This is extremely useful only if the trader uses this ratio from the percentage aspect and not in the Dollar / Rupee aspect. If not, he/she is bound to get very poor and inconsistent results and this randomness in results will shatter the confidence, leading to more failures.
There is a huge difference between risking 10% and gaining 20% (Equal Percentage) and risking 10000 and gaining 20000 (Equal Amount). However, both of them have the common Loss/ profit ratio that is 1:2. We will dwell deeper into it in the next session.
Drawback of Equal amount Position sizing model:
In an equal amount model, we decide a certain amount that we can afford to lose and then multiply it by 2 for our target, so that we have a 1:2 Loss/ Profit ratio. Let us see how it goes in the first ten trades. Let us assume that the trader is willing to lose 10000 INR each trade and his targets are set at 20000 INR when he wins. So the loss/ profit ratio is 1:2.
See the table below:
| Trade Number | Trading capital | Profit / Loss |
| Trade 1 | 100000 | 90000 |
| Trade 2 | 90000 | 80000 |
| Trade 3 | 80000 | 70000 |
| Trade 4 | 70000 | 60000 |
| Trade 5 | 60000 | 50000 |
| Trade 6 | 50000 | 70000 |
| Trade 7 | 70000 | 90000 |
| Trade 8 | 90000 | 110000 |
| Trade 9 | 110000 | 130000 |
| Trade 10 | 130000 | 150000 |
In the above example, it is assumed that the trader loses in the first five trades. He loses 10,000 INR each trade. So at the end of fifth trade, he has just 50,000 INR as capital. From 6th – 10th trades he wins 20,000 INR each trade and his net profit becomes 1,50,000. Impressive right?
Definitely, this tells us that having a 1:2 target is very important for our trading success.
Even though the trader loses the first five trades consecutively, he ends up with profit at the end because of the target ratio 1:2.
But, wait. Let us see the % of change that happens after each trade. See, the table below:
| Trade Number | Trading capital | Profit / Loss | % of change |
| Trade 1 | 100000 | 90000 | -10% |
| Trade 2 | 90000 | 80000 | -11% |
| Trade 3 | 80000 | 70000 | -13% |
| Trade 4 | 70000 | 60000 | -14% |
| Trade 5 | 60000 | 50000 | -17% |
| Trade 6 | 50000 | 70000 | 40% |
| Trade 7 | 70000 | 90000 | 29% |
| Trade 8 | 90000 | 110000 | 22% |
| Trade 9 | 110000 | 130000 | 18% |
| Trade 10 | 130000 | 150000 | 15% |
In the above table you can see the % of change after each trade. Now, look carefully at Trade 6 – (Bold Line), after five consecutive losses the trader now has only 50,000 with him. Now to get 20,000 INR as per his initial loss/profit ratio he has to gain 40% in that trade.
Also, see how the percentage of change varies after each trade in the below chart:
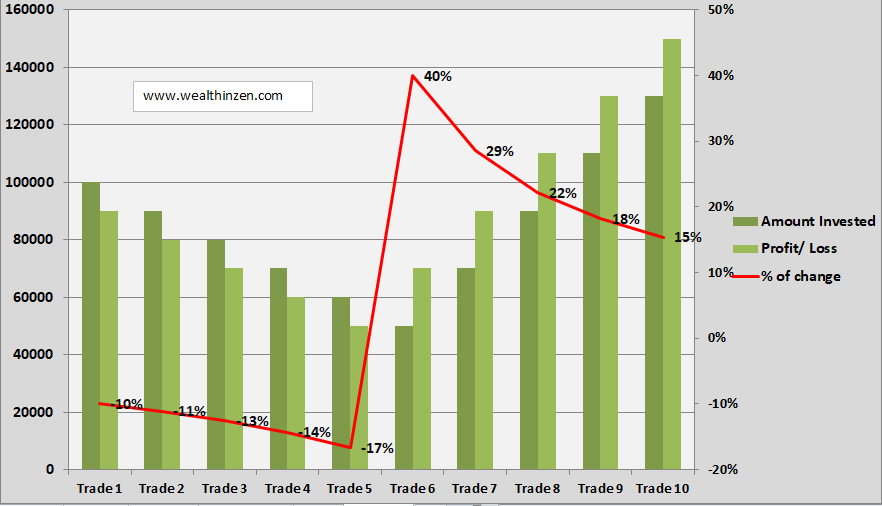
Imagine the stress the trader has to go after five consecutive losses and to get 40% profit in his next trade. What is the probability of him taking the right trading decisions and to control his emotions after the losses?
I hope, now it’s clear, how an equal amount position sizing will be very misleading and also inconsistent. This is where the beauty of the “percentage based position sizing model” lies.
Equal amount Vs Equal Percentage model:
The advantage of the percentage model over the equal amount model is tricky to understand because it does not make much difference when your portfolio is small and when the number of trades taken are small. See the table below:
| Equal Amount Model | Trading capital | Profit / Loss | % of change |
| Trade 1 | 100000 | 90000 | -10% |
| Trade 2 | 90000 | 80000 | -11% |
| Trade 3 | 80000 | 70000 | -13% |
| Trade 4 | 70000 | 60000 | -14% |
| Trade 5 | 60000 | 50000 | -17% |
| Trade 6 | 50000 | 70000 | 40% |
| Trade 7 | 70000 | 90000 | 29% |
| Trade 8 | 90000 | 110000 | 22% |
| Trade 9 | 110000 | 130000 | 18% |
| Trade 10 | 130000 | 150000 | 15% |
You can see that, in equal amount model, even after five consecutive losses, the trader ends up with a profit of 1,50,000 INR which is impressive.
Now see the first ten trades of Percentage based model in the table below:
| Equal Percentage model | Trading capital | Profit / Loss | % of change |
| Trade 1 | 100000 | 90000 | -10% |
| Trade 2 | 90000 | 81000 | -10% |
| Trade 3 | 81000 | 72900 | -10% |
| Trade 4 | 72900 | 65610 | -10% |
| Trade 5 | 65610 | 59049 | -10% |
| Trade 6 | 59049 | 70859 | 20% |
| Trade 7 | 70859 | 85031 | 20% |
| Trade 8 | 85031 | 102037 | 20% |
| Trade 9 | 102037 | 122444 | 20% |
| Trade 10 | 122444 | 146933 | 20% |
Here, the net profit after ten trades is positive, that is 1,46,933. Now, you may wonder that the percentage model has given less profit than the equal amount model. This is because, after each loss your betting amount decreases accordingly. In the third trade you bet only 10% of 81000 INR, that is 8,100 INR and in fourth trade you bet only 10% of 72,900 that is 7290 INR, instead of betting 10,000 INR each trade as in the equal amount model.
Also, note that the change of percentage remains constant for losses at 10% and for profits at 20% unlike the equal amount model where it changed randomly for each trade.
So what? I get more money in an equal amount model than a % based model. Let me follow that only. I can hear that. But wait. Just ten trades are not enough samples to rely on right? Let us do the math for forty trades.
If I repeat the same process for next 40 trades in an equal amount model and % model assuming that losing every five trades consecutively, followed by next five consecutive winning trades, at the end I get
- 3,00,000 as net profit in Equal amount model and
- 4,66,096 as net profit in Percentage model.
This means the net change for
- Equal amount model is 200% while for
- Percentage amount mode is 366%
See the image below:

It is clear from the image that though the profits run without much difference in initial trades, as the trades increase and the capital increases the profits of the % based model is far far superior. ( red arrow).
After taking the exact same trades you end up with 366% gain in the percentage model while you end up with 200% gain in the equal amount model.
Importance of Seeing everything in Percentage:
Human mind is trained to see everything in quantity. Having three cars is better than two cars, 4 Lakhs is better than 2 Lakhs. It is obvious. Higher the number, higher the satisfaction. This comes in trading also. You would have come across people who are happy to buy a share worth 100 rupees more than 1000 rupees share. If he has 1,00,000 to invest he is very curious to buy a share trading at 100 rather than 1000. Why?
With 1 Lakh he can buy 1000 shares, while if he buys 1000 Rupees shares he can buy only 100. Who wants a lesser quantity of shares for the same 1 Lakh?
That’s why penny stocks are still a hot cake for beginners. They spend more time searching for a multi-bagger penny stock. They love penny stocks. They believe that 1 rupee worth of shares will easily reach 10 rupees within days. But what they don’t understand is, it needs a 1000% gain to reach 10 rupees from 1 rupee.
Next time when you come across such a person, just ask them this calculation and I bet most would not have even thought of that.
The same thing happens in assessing the portfolio’s performance. A person with 20 Lakh portfolio scares to the core when his portfolio shows a 1 Lakh loss. He becomes frustrated. However, in percentage terms it is just a 5% loss. 1 Lakh may seem to be big. But not for a person whose portfolio is 20 Lakhs worth. That’s why understanding drawdowns in terms of percentage is very important.
Seeing everything in percentage reduces stress, reduces biased decisions and increases clarity. Let us train our mind to see everything in percentage. Happy investing to all !!!
Key Takeaways:
- Position sizing based on the percentage model is definitely far more superior than the equal dollar model.
- In small portfolios and in initial days it may not be that significant, but as the portfolio grows, the percentage model works fantastic.
- The coin toss theory should be understood in its true sense and not superficially.
- Training our mind to see trading from a mathematical viewpoint helps us to give more clarity and take well informed decisions with courage and confidence.


3 thoughts on “Best Position Sizing Model (A deeper understanding of percentage based Position sizing)”