 by
by Hi all !!!
In the previous article we saw High Tight Flag pattern – a bullish continuation pattern. We saw the chart pattern with examples and how to spot them and also how to trade them effectively. Similarly, in this article we will see another continuation pattern and a variation of the high tight flag pattern – the FLAG PATTERN.
I know that you will be wondering what is there in the Flag pattern to learn? It is just a simple, common pattern that occurs often in charts and we just have to play the breakouts. Yes, you are right and I also thought the same until sometimes back. But, when I started studying the pattern I found that this chart pattern has much more to it and we should tell just by a glance whether the pattern has the highest probability of success or not. Remember, I use the word “ Probability” since everything in trading is probability. We should be realistic in setting our goals.
After all, visualizing chart patterns is an art. You should look at the chart similar to how, a master trader will look into it. Superficial visualization gives you nothing. But if you start to look into something deep you can understand the language it speaks. Buddha says that if you are willing to listen, you can hear the “Rivers, wind, sun” anything. Living / non-living does not matter. Then why not the charts?
Okay, now let us dive into the topic and in this article we will be seeing the nuances and some rare tips to trade this flag pattern. I am a positional trader and hence I will be talking only about long side trades. The opposite of what I talk about can be applied to the downside also. Flag pattern is a continuation pattern that can be either on upside / downside.
Topics Covered at a glance:
Typical Characteristics of a FLAG Pattern
Tips and strategies for super performance
Setting up a target – How to calculate?
Winning Rates – How successful the pattern is?
What is the Flag Pattern?
A flag pattern is a technical analysis charting pattern that is often used in trading to predict potential price breakouts. It is typically characterized by a sharp price move followed by a period of consolidation, during which the price oscillates within a narrow range. The pattern is formed by two parallel trend lines that form a “flag” shape on the chart.
The flag pattern is considered a bullish pattern when it occurs after an uptrend, as it suggests that the underlying asset’s price is likely to continue to rise. Conversely, a flag pattern that occurs after a downtrend is considered bearish, as it suggests that the price is likely to continue to decline.
As traders, our job is to watch out for potential breakouts and then enter the trade with proper position sizing.
Typical Characteristics of a FLAG Pattern:
To find a proper flag pattern, we should look into the following traits:
Prices within a flag pattern are bounded by two parallel trendlines:
Prices within a flag pattern often move in the opposite direction of the overall trend: they may rise during a downtrend or fall during an uptrend, though exceptions do occur. These price movements can be connected by using two trendlines resembling a small channel.
Time period for the formation of the pattern:
Flag patterns should be short-term, lasting from a few days to three weeks. Formations lasting longer than three weeks are usually classified as symmetrical triangles, rectangles, or wedges (either rising or falling).
Also, when a flag formation occurs more than three weeks, people usually lose interest. Most of the traders who are impatient will want to get out of the trade as soon as possible. So, when the beak out occurs, these traders exit the stock thereby denting the momentum to some extent. But, the trend usually resumes once the weaker hands are out.
Steep, Quick price trend:
Flag patterns usually form near the midpoint of a steep, quick price trend. If the preceding trend is not strong, the flag pattern should be ignored.
Volume trend during the flag formation:
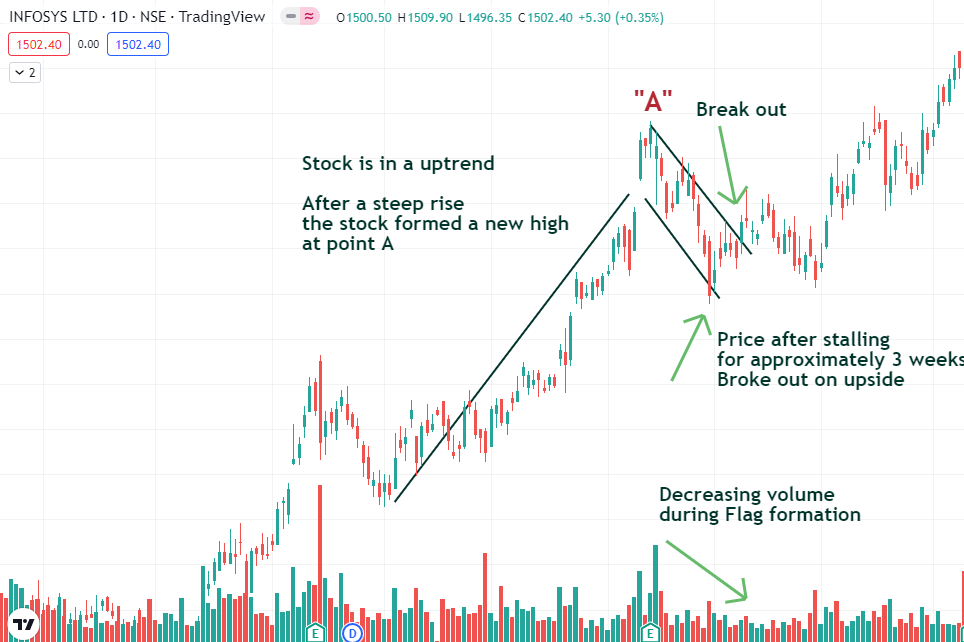
During the formation, volume tends to decrease. This is a very important thing to note down. Flag formations are nothing but a pull back that resembles a flag. So, obviously during the pullbacks, the volume should be lower and on the breakout the volumes should be higher.
See the image below:
Daily chart of Infosys (During Jan 21) showing the flag formation.
Tips and strategies for Super performance:
Always look for good volumes on breakout and follow up:
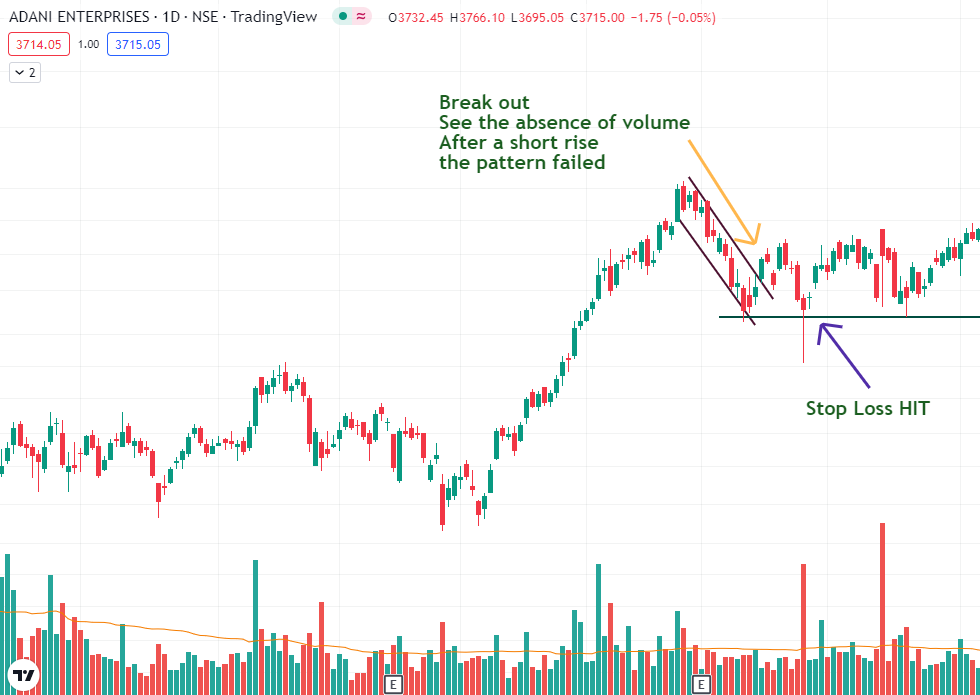
The volumes at the time of breakout should be convincing. That is because when the price is breaking the trendline and moving into higher zones it should definitely be supported by good volumes. Good volumes show increased buyer interest. We need buyers to push the stock higher. Always look for it. If the criteria is not met, look for another opportunity.
See the image below:
After the breakout of a fantastic flag trendline, the pattern failed. One reason could be lack of volume support during the breakout.
Align with the major trend:
I had seen many trades that had not worked in my favor. One of the reasons I saw was that the short term trend was not aligned with the long term trend. When both the trends are aligned the results are good and the probability of success increases.
Sometimes, the short term moves will be so good that we will skip our rules and take the trade. Such a temptation will be the pattern.
See the image below:
This is a daily chart of Mahanagar gas LTD. You can see how beautiful the flag has formed after a massive run up. Within a few days the flag completed and gave a breakout, only to fail later.

Loss of volume on breakout could also be a reason for the failure. But, just when the stock was zoomed out and the long term trend was noted it was in a strong downtrend.
See the image below:
The same chart with zoomed out larger picture, tells us a different story. That’s why it is an art to select stocks and focus on particular names. Patterns anyone can find. But, one should keep on developing the skill of pinning down a few names.

See for correction that are short and quick:
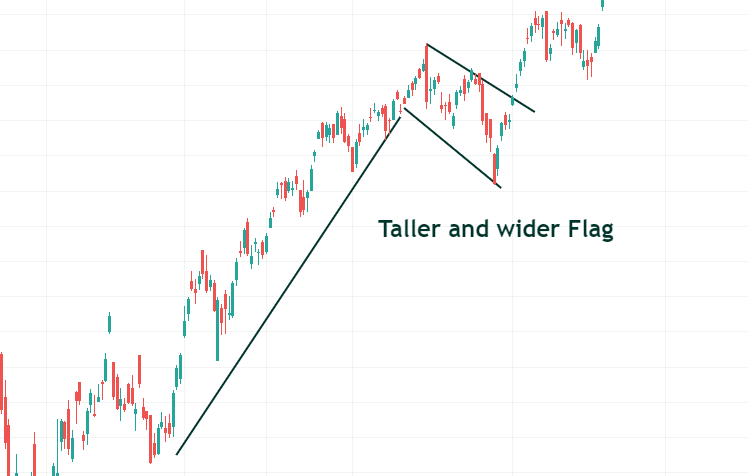
One should note that the flag pattern with taller poles seems to perform better than a shorter pole. This is common sense because the flag with a larger flagpole shows tremendous strength and momentum compared to the shorter flagpoles.
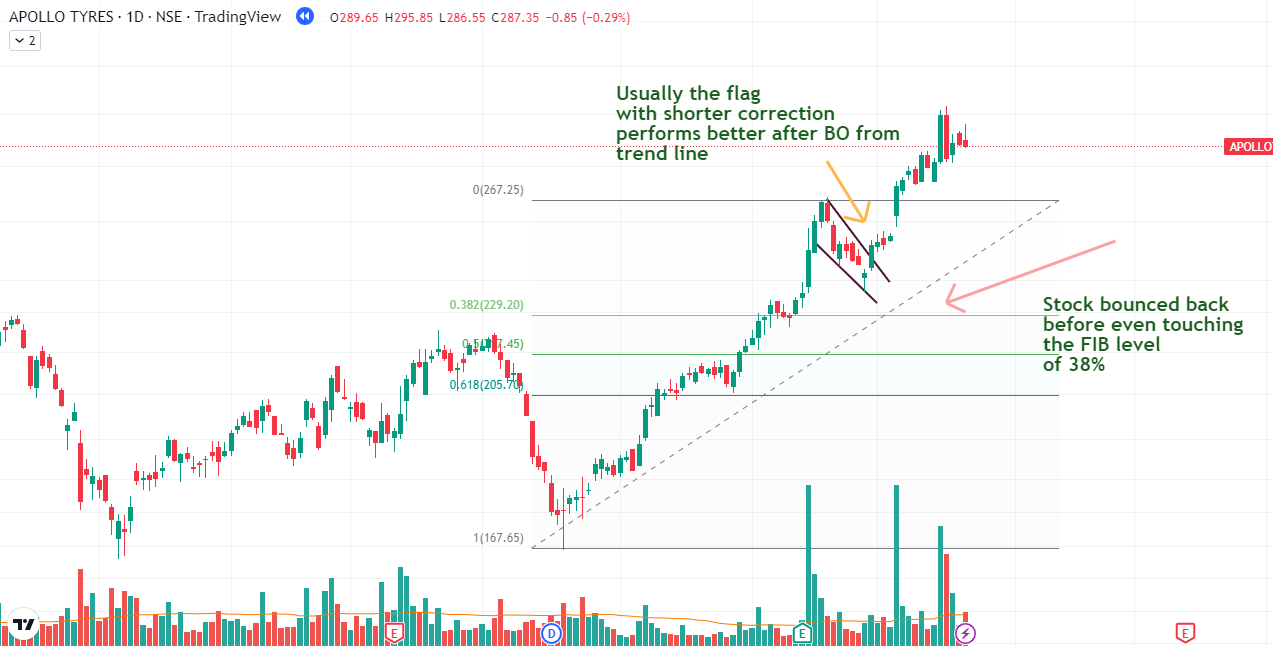
Also, when the flag formation occurs before the 50% Fib retracement level and the breakout happens before the 50% FIB Retracement level is breached the results are good. Lesser the retracement stronger the pattern.
See the image below:
Apollo Tyres retraced and formed the flag before 38% FIB levels and showed a nice up move. See the volumes while breakout.
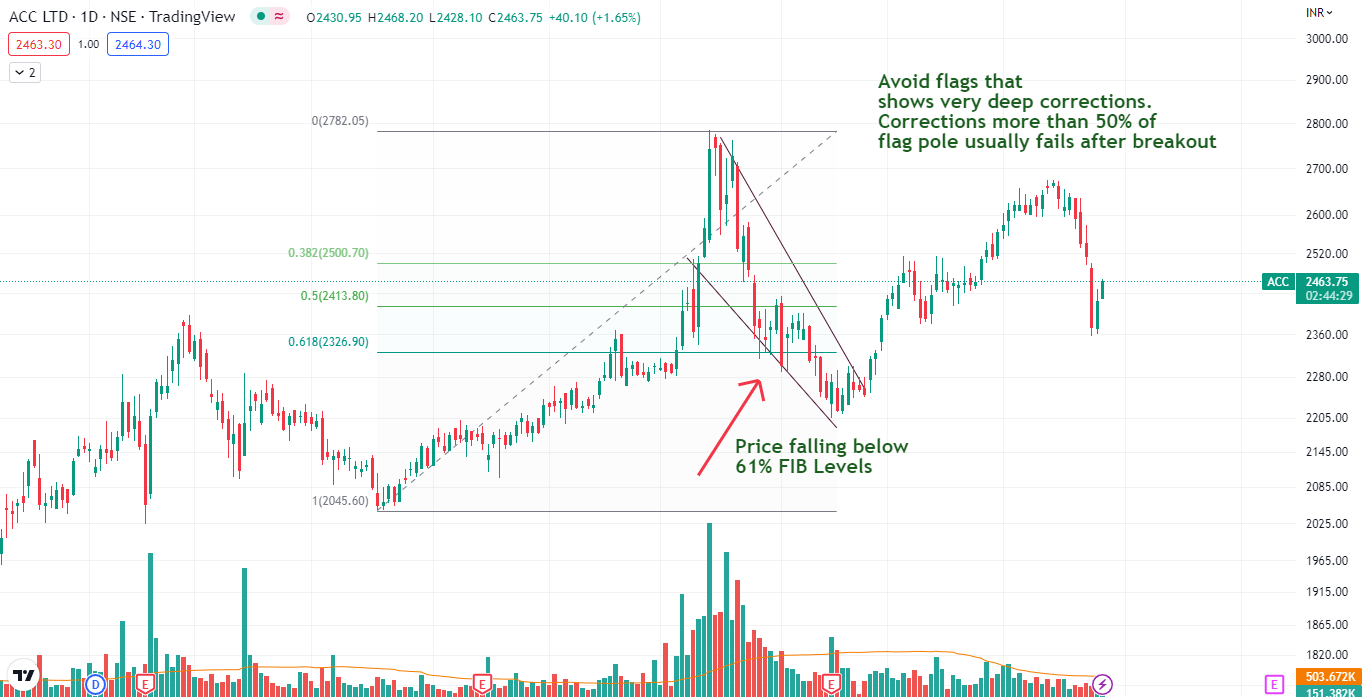
Don’t go behind stocks that have breached the FIB levels more than 50%:
When the corrections are deeper and the flag is getting formed below the 68% FIB levels it is more prone to failure.
See the image below:
Though the stock has seemed to perform better after the breakout and the SL is not hit till now, see the sluggish move and rapid pullbacks after the breakout. We don’t want this. We want a tennis ball action. Just how a tennis ball keeps on jumping the stock should jump high and high with least resistance.
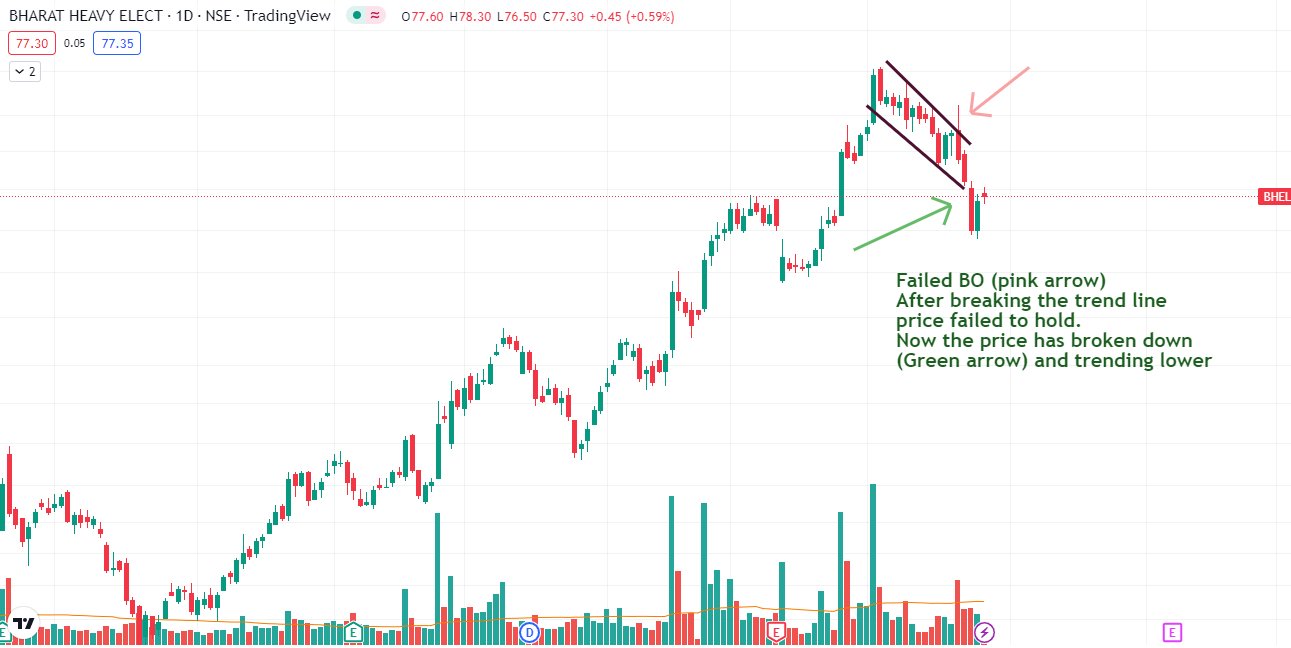
Avoid Pre-empting:
The breakout should happen clean. If you are trading in hourly TF then BO should happen clean and clear in that TF. If you are in Daily TF then wait for the day’s close to enter. This will avoid false breakouts.
See the image below:
Daily chart of BHEL showing the failed breakout (Pink arrow) of flag trendline:
Wait for structure to develop after Breakout:
Don’t be in a hurry to make profits. Profits come for those who have a plan and patience. Plan you can copy anyone’s. But patience is in your hands. Do you know that the bull market is the toughest to make money and many fail to beat even the index?
So, wait for the structures to develop. Allow the stop loss to be hit. Nothing wrong with it. You should not worry about your SL getting hit, but if you don’t close the trade after SL being hit then it is a matter of concern.
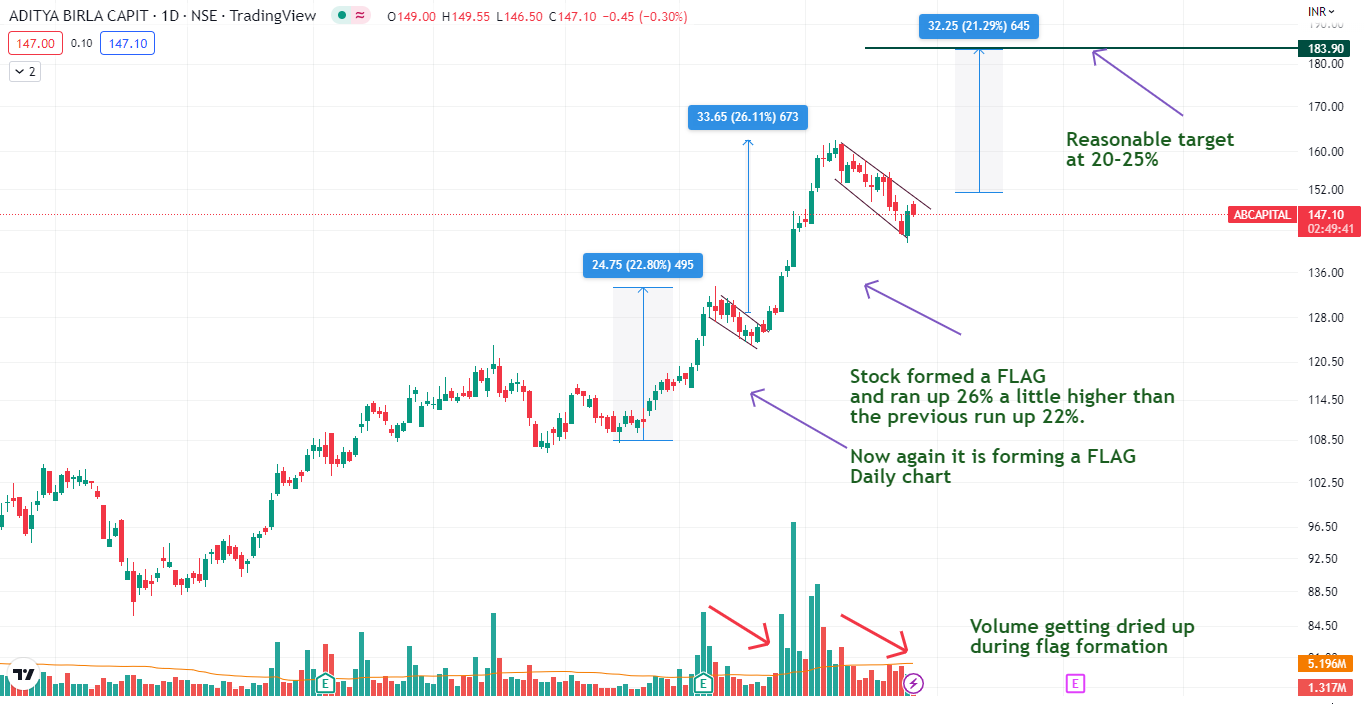
Setting up a target for Flag Pattern:
The target can be kept similar to the % of move of the previous flagpole. “Thomas Bulkowski” in his book “Encyclopedia of chart patterns” says that the move after the flag breakout is little smaller when compared to the previous move.
So, it is wise to keep a target somehow lesser or one can start booking profits when the stock moves to the level of the previous run.
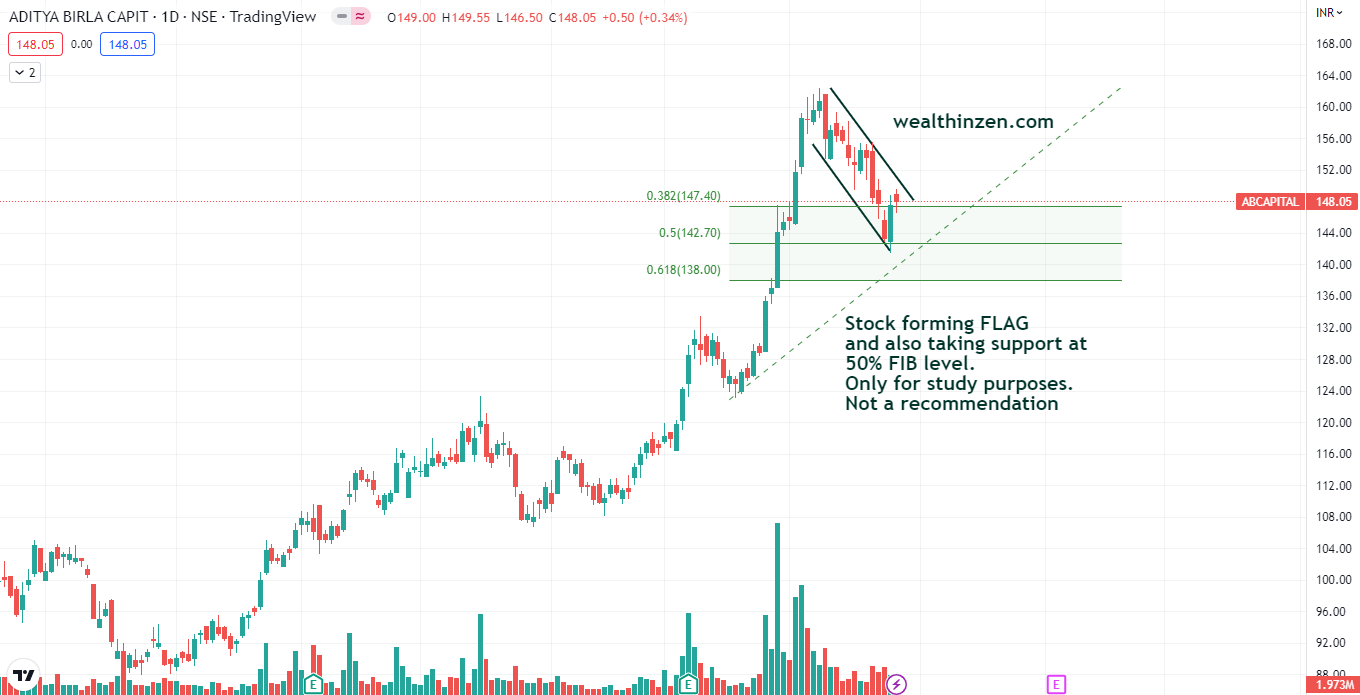
See the example below: (The stock is not at all a recommendation. Only for study purpose)
Beautiful chart of Aditya Birla. The stock after a flag breakout usually runs up 20-25%. So, one can try setting a target of that for the next move. Chart as on Dec 2022.
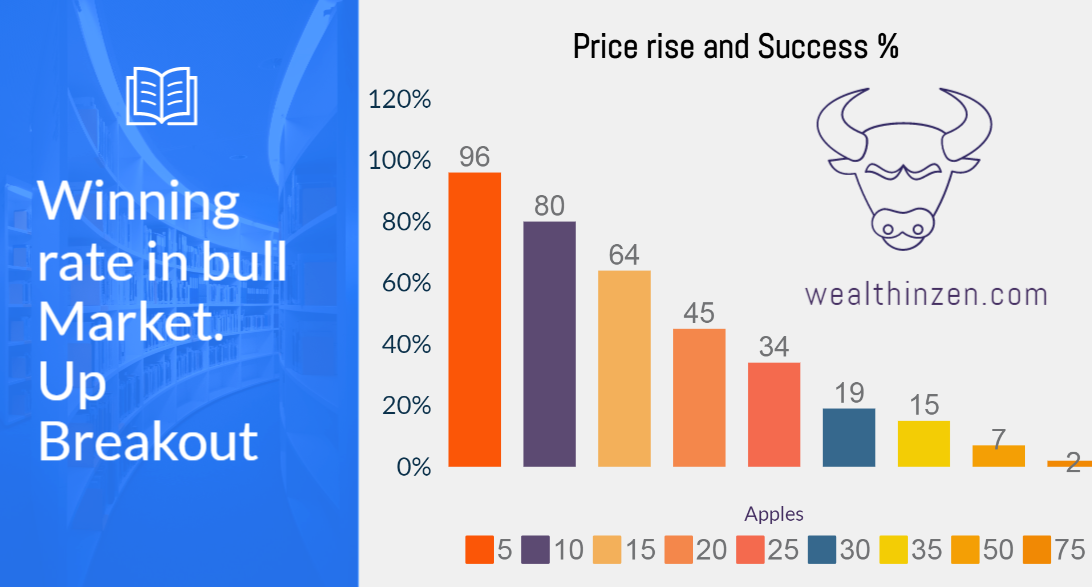
Winning Rates of Flag Pattern:
Winning rates depend upon the targets. These winning rates are based on the book “Encyclopedia of chart patterns” written by Thomas Bulkowski.
See the image below:
The winning rates are calculated depending on the targets reached. For example, in a bull market the upward breakout reaching 5% target is 96%. It means that 96% of the breakout reaches a target of at least 5% price rise.
So if you keep a target of 5% and play the flag pattern as per this research you will win 96% of times. (But don’t get carried away, this is just a research article done with select samples, published by Thomas Bulkowski. Reality may be different.)
Similarly, only 2% of breakout patterns reached a target of 75%.
So, when playing these patterns one should keep in mind that a target of 10-20% should be ideal as the winning rates are 80% and 45% respectively.
Source : “Encyclopedia of chart patterns”
Similarly the winning rates for break out in bear market is given below:
You can see that the Flag pattern Breakout gave a return of more than 50% in only 2% of the case. The graphs may be a little confusing. But, read it one to two times again and you will get it.

Source : “Encyclopedia of chart patterns”
Some current examples:
Not a stock recommendation. Only for study purposes.
ADITYA BIRLA CAPITAL:
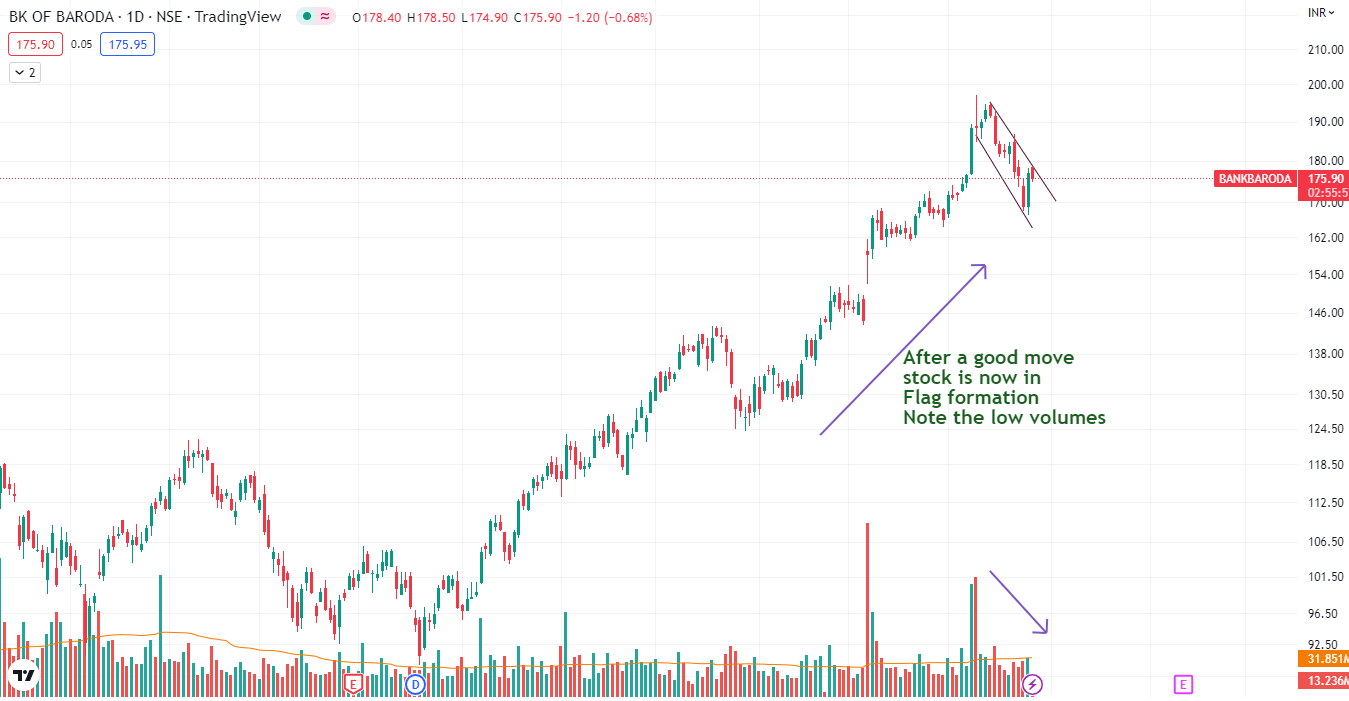
Bank of Baroda:
This is the type of flag one should look into:
Conclusion:
So, I hope this explanation would have given you enough details on the Flag pattern. These minor details will help one to take a better trade and be on the side of winning most of the time.
Apart from this, the number of open positions you have at a given time, position sizing will determine your success. I will keep repeating these lines whenever I can, even if it feels repetitive.
If you like my writings you can consider subscribing to my newsletter and also you can share the article with your friends / Social media. Also, you can follow me on Twitter @wealthinzen
Happy investing !!! See you all with a next relevant and useful topic.