 by
by There are no indicators till date with 100% accuracy. However, one can make fortunes in trading / investing by knowing simple things and understanding the logic behind indicators. The key point for using an indicator successfully is to make sure that you know what you want with them. One such indicator that is widely used by traders is the AVERAGE TRUE RANGE Indicator or ATR Indicator. This indicator is also known as the Volatility Indicator since it takes the volatility of the asset / stock for predicting the movements.
In this article, I am going to share my views on how one can use this indicator as an adjunct to their existing trading strategy and also some useful practical tips to use in real time trading. I will also tell what mistakes one should avoid when using this Indicator.
ATR Calculation:
Knowing basic math behind the calculation of ATR will help in understanding the logic of this indicator.
It is calculated by taking the average of the true range values over a specified period of time. The formula to calculate ATR is as follows:
- Calculate the true range (TR) for each period:
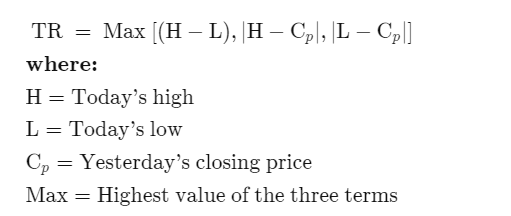
Source: Investopedia
- Calculate the average true range (ATR) over a specified period of time:
- ATR = (TR1 + TR2 + … + TRn) / n
where n is the number of periods used for the calculation.
For example, if you want to calculate the 14-day ATR, you would first calculate the true range for each of the 14 days, and then take the average of those values.
Thus, you can see that ATR takes into account the volatility of the asset in the recent days to predict the movement in the near future.
Plotting ATR in Trading View:
Go to Tradingview.com and search as AVERAGE TRUE RANGE in the indicator section.
Once you click that, ATR indicator will be plotted.

Using ATR to set up stop loss:
The most common use of ATR is to set a proper stop loss. Usually the stop loss is set at a multiple of two.
See the image below:
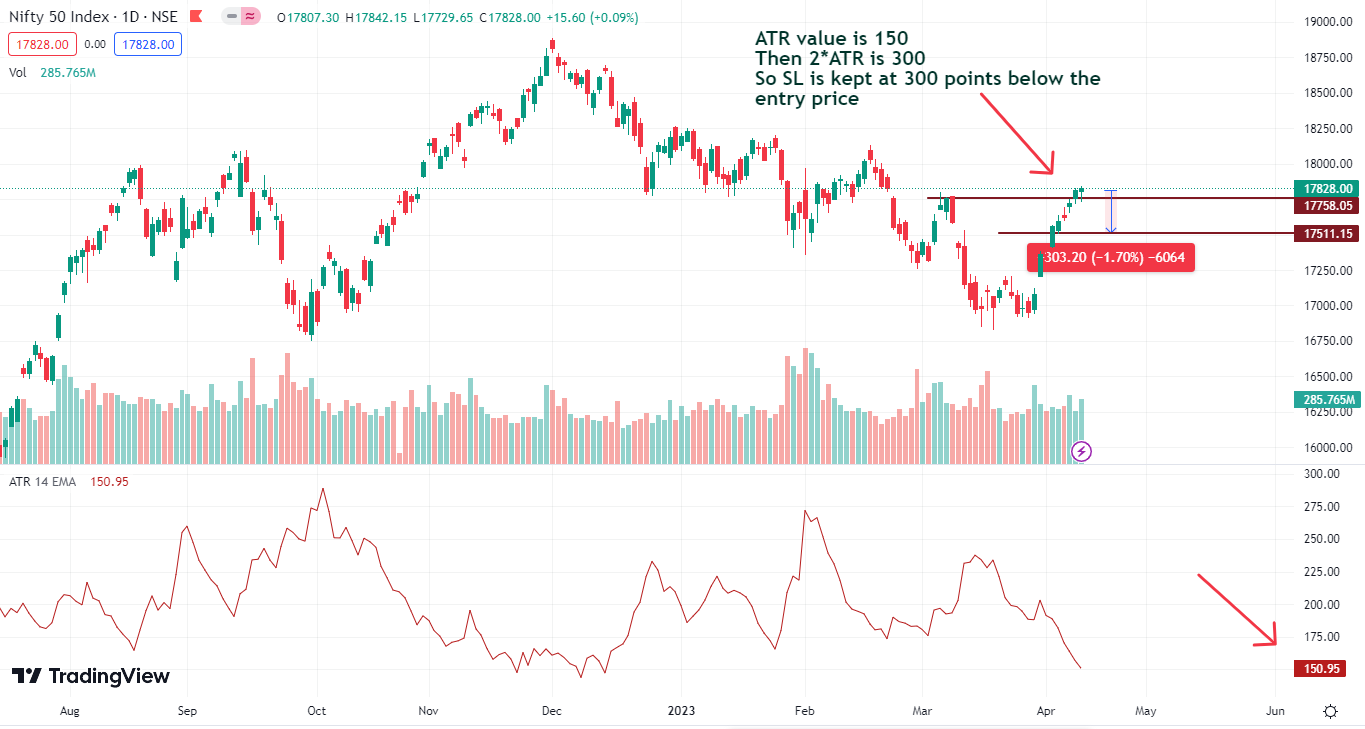
The above image is of NIFTY 50 Chart. Assume that you want to go long, since the NIFTY 50 has gone into Higher High structure after a long time. The 14 Day ATR is plotted in the lower pane with a red line. On the day of trade (red arrow) the ATR Value is found to be around 150. So, an ATR based Stop Loss will be 2*150 = 300 points below the entry price.
The logic is, the average volatility for the past 14 days was 150. Suppose if the volatility crosses twice the normal volatility (300 points in our case) and hits the stop loss then there is something wrong in our prediction. Some sentiments have changed in the short term. That is why it is showing abnormal volatility. So, it is better to get stopped out with a small loss and see what happens next.
Using ATR For Position Sizing:
Another, major but less explored use of ATR is to position size our holdings. If you had read VAN THARP he has explained about various position sizing models in his book. “Trade your way to financial freedom”.
I had summarized these strategies for position sizing in my article “ How to Position Size for trading success? “. Interested people can find the details over there.
One can use the ATR as a stop loss and also to calculate how much shares can be bought. I had developed a free position sizing calculator for different strategies. You can always check out how much stocks you can buy at a given time using the calculator as shown below:
The image below shows how one can use the calculator to know the exact amount of shares one can buy with ATR based Stop Loss :
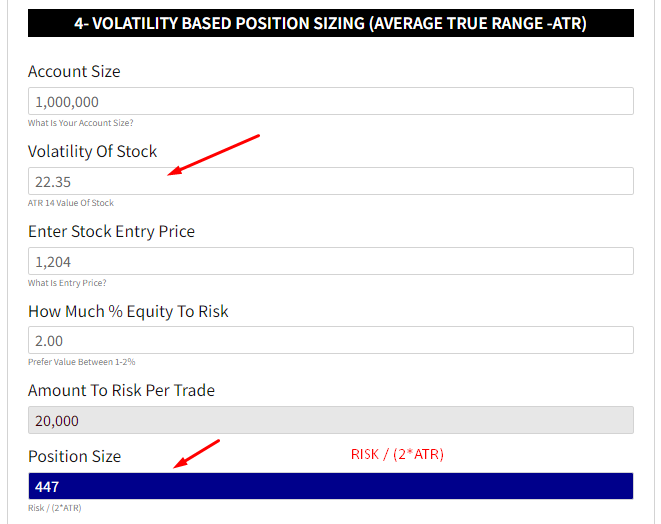
In the above calculation, if one can lose 2% of portfolio in a trade with an Entry Price of the stock around 1204 and the volatility (ATR 14) is around 22.35 then he can buy 447 shares of that company, if he risks 2 ATR.
2 ATR works out to (22.35 *2) = 44.7. It means our risk is 44.7 pips per share.
So, if we buy 447 shares of the company as suggested by the calculator, then if we lose the trade we will be losing 19980. That comes to 2% of our account size (1 million).
Drawbacks of ATR:
Dynamic in Nature:
ATR is a dynamic type of indicator. The ATR value with which you used to put stop loss keeps on changing day by day and hence you should keep track of it daily.
Does not predict the direction of movement:
Although ATR measures volatility and helps in predicting the stock movement one cannot predict which side the movement is going to be. Increased volatility does not always mean bad. When the stock prices move erratically then also volatility rises.
Variables are subjective:
This is another important drawback which most traders under estimate. An indicator should be less subjective and be more objective. What I mean by this is, in the case of ATR some traders use 14 day ATR while some use 20 day ATR. It is completely subjective.
Similarly, the stop loss is set by 2* ATR by most traders, but conservative traders use 1.5*ATR and aggressive traders use even 3* ATR to avoid whipsaws.
Whether you use 1.5, 2 ,3 or even 4* ATR is also completely subjective. Don’t make the mistake of switching from one value to another. Keep focused on using one value for a considerable period of time and then see the results. More important is to track your trades with a perfect trading journal. I had given a link to a free excel sheet in that article which you can download and use for your trades.
TIME-FRAMES AND ATR – Avoid this mistake:
Another common mistake traders make is to take trade based on a weekly chart and set the Stop Loss or Position size based on Daily ATR. Both are different. 14 ATR on a weekly and Daily chart are completely different. Stick to one time frame.
See the image below:
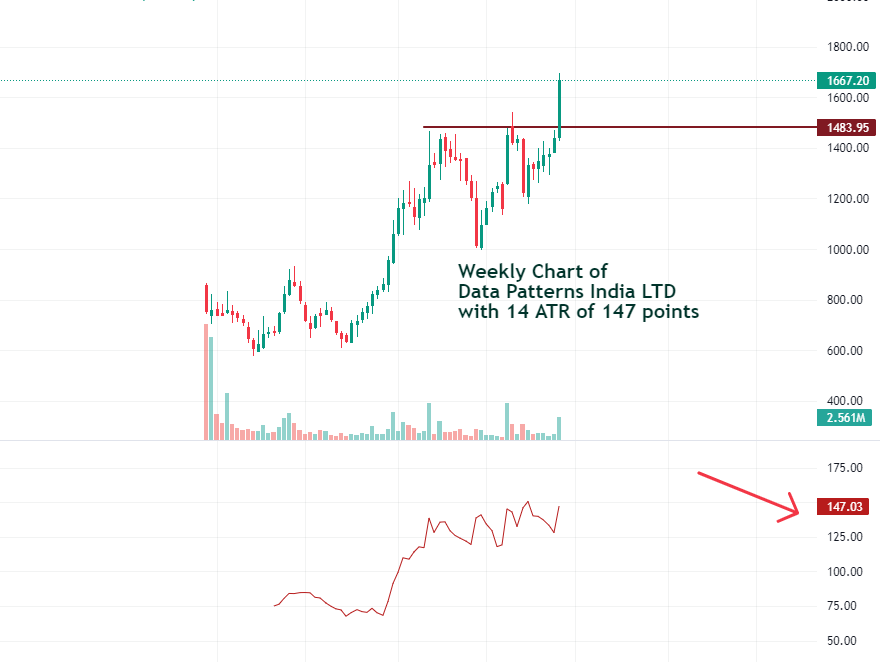
In weekly we should set a stop loss of 2*ATR = 2*147 = 294 points from the entry price.
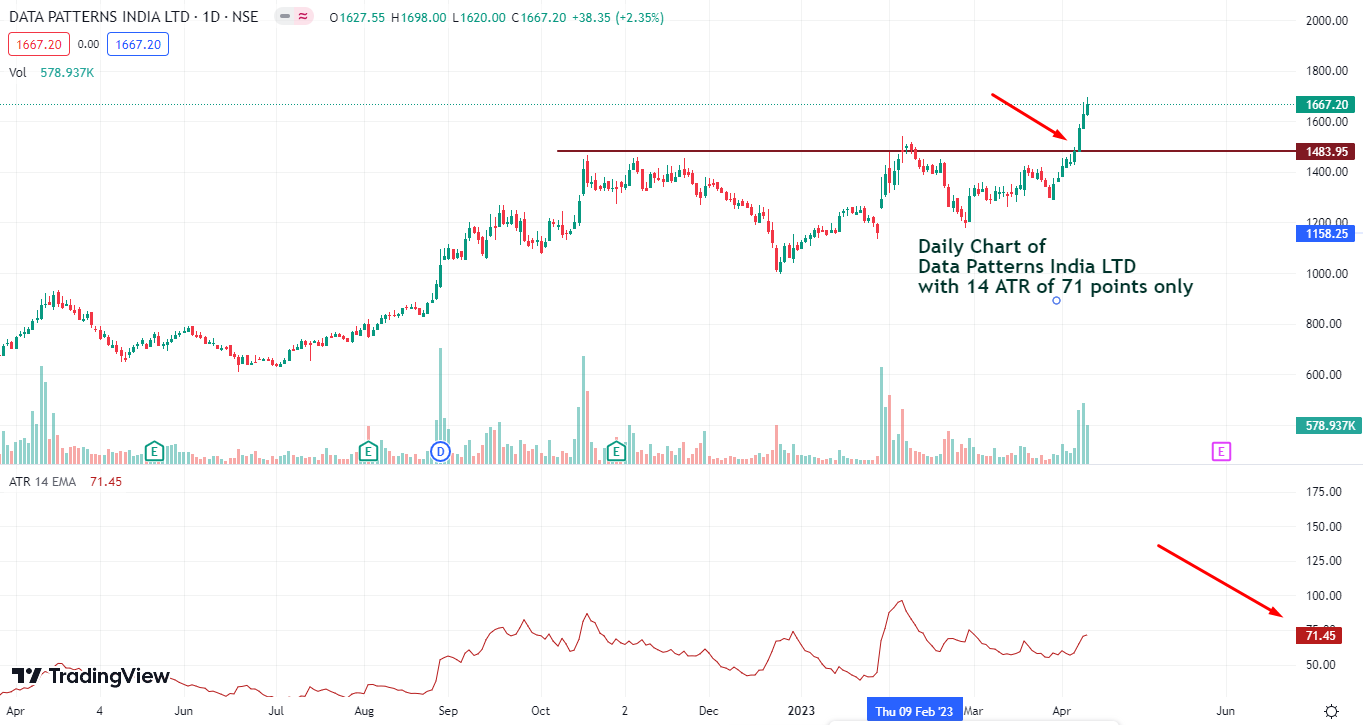
However, in the daily chart the ATR 14 is only around 71 points. So, the SL will be set at 71*2 = 142 Points from the entry price.
KEY TAKEAWAYS:
ATR is a wonderful indicator to analyze the volatility of the stock at a given point of time.
It should be used as an adjunct with your trading strategies to maximize the benefits and it should never be used as a standalone tool. You can improve your risk reward ratio if you use this indicator properly.
I personally feel that using ATR for position sizing is much more useful than just to use it as a stop loss setting indicator.
Avoid switching from one variable to another, like 14 ATR to 20 ATR and then to something else without giving considerable time.
If you like my writings, you can consider subscribing to my newsletters, so that you will get my articles delivered right into your inbox.
All the charts and stocks discussed are for study purposes only and not a recommendation.