
 by
by Hi all !!
As the market is getting steady and nearing an all time high zone again, many stocks are breaking out. Identifying which stocks to buy among the stocks that break out daily is definitely not a small thing to do. We have to be very selective in what we buy, we can’t buy everything that keeps breaking out. All our capital is limited.
I had already written an article on how keeping a small and focused portfolio will double your account faster. Do read it if you want to become successful sooner. It is very common to see the sister stock movements in a bull market.
Sister stock movement concept was popularized by the legendary trader “Jesse Livermore”. It is nothing but two or more stocks belonging to the same sector moving along together with similar chart patterns. This is because companies within the same sector/ Industry are generally influenced by similar economic conditions, industry trends, and external factors.
However, it’s important to note that while stocks within the same sector often move together, there can still be significant variations in individual stock performance based on company-specific factors such as management decisions, financial health, and competitive advantages.
Selecting stocks based on Sector Strength can give us an edge on narrowing down the stocks. Even then, sometimes we may be left with multiple options when the market is going strength to strength. One such sector / Industry I had noticed in recent times is the Insurance Industry based stocks.
In this article, I will be discussing how stocks in the same sector / industry tend to move in a similar fashion at times. This correlation enhances our conviction to buy our favorite stock from that sector, thereby increasing our odds of winning.
Disclaimer: Stocks mentioned in this article are purely for educational purposes only. I may or may not hold positions in these stocks. Also, the stocks mentioned here may have crossed their exact buy points and that’s why I release these articles a little late to avoid any conflict of interest. I am not a SEBI registered analyst. Kindly, do your own research before investing.
Sister Stock movements:
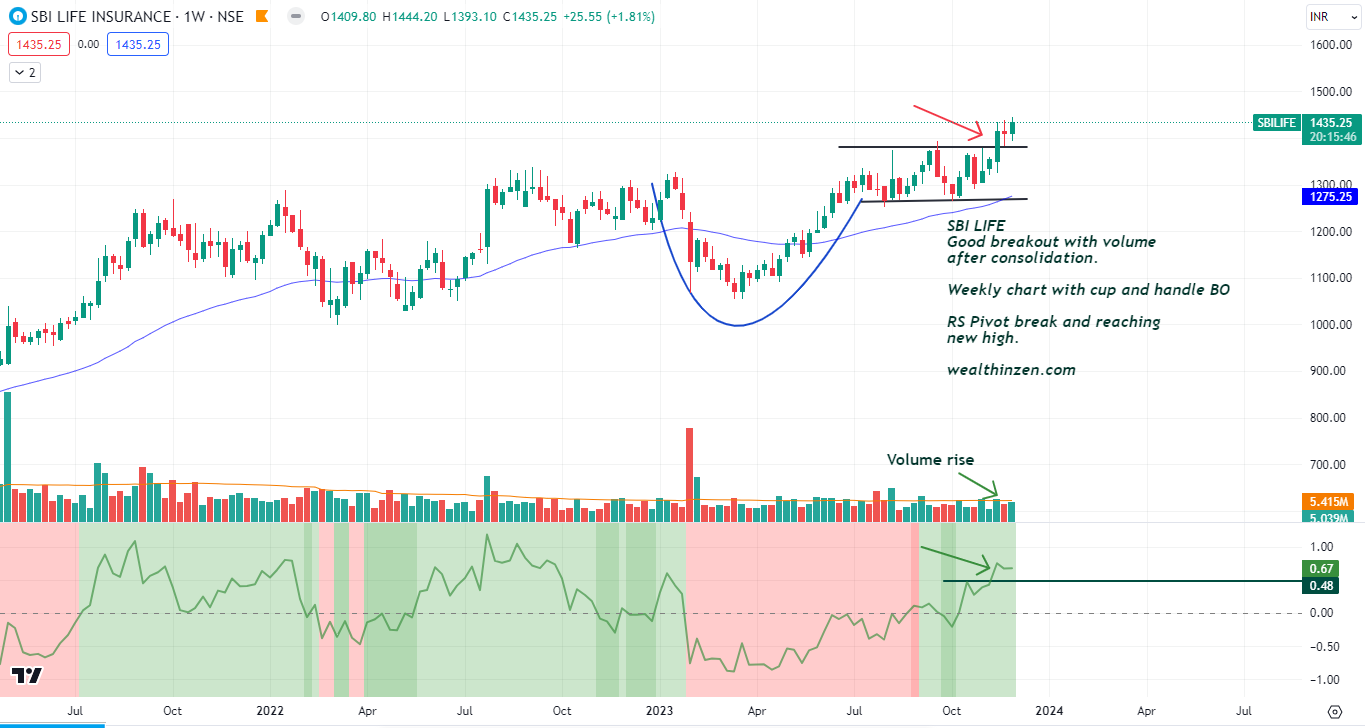
First, let us see the chart of SBI LIFE INSURANCE. Below is the weekly chart, see the beautiful cup and handle breakout.
Daily chart of SBI LIFE:
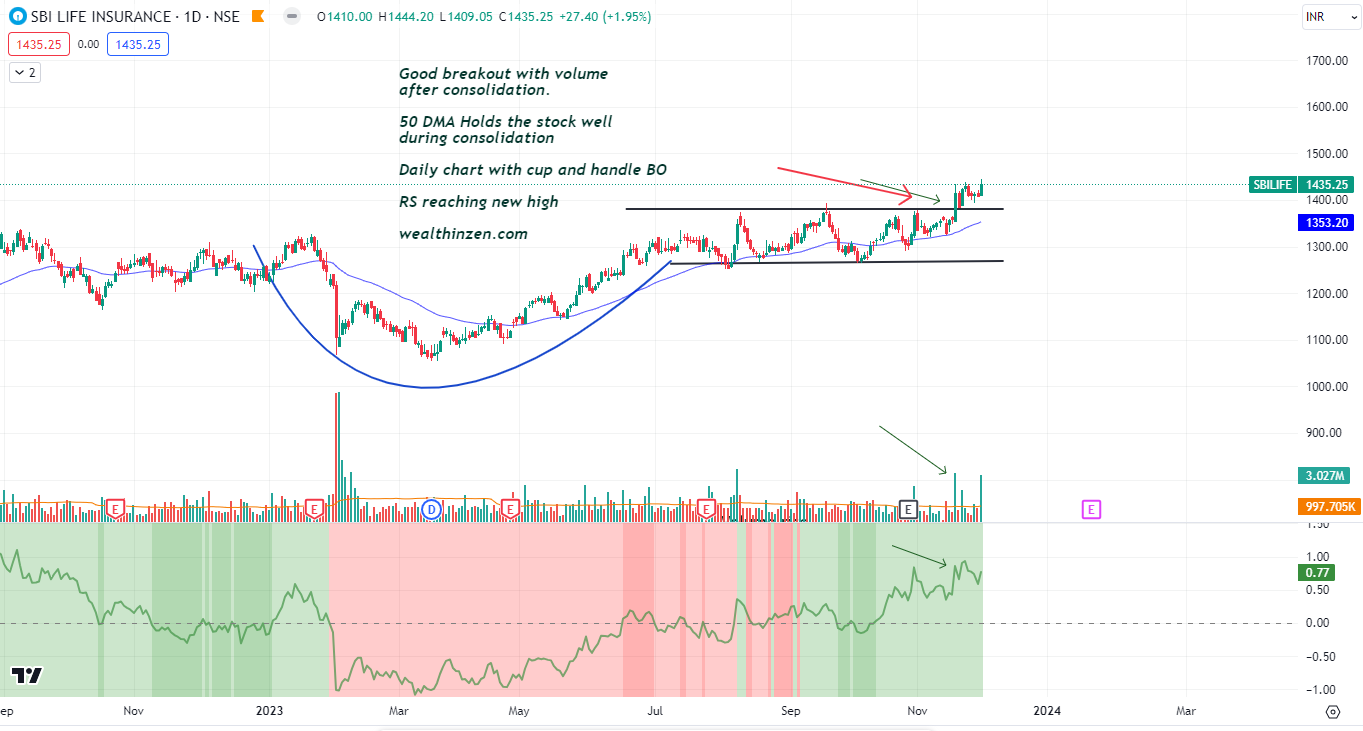
Now, once I saw this beautiful breakout I started looking into other stocks of the same Industry for conviction. Let us see how the other stocks also have similar breakout structures:
ICICI LOMBARD General Insurance:
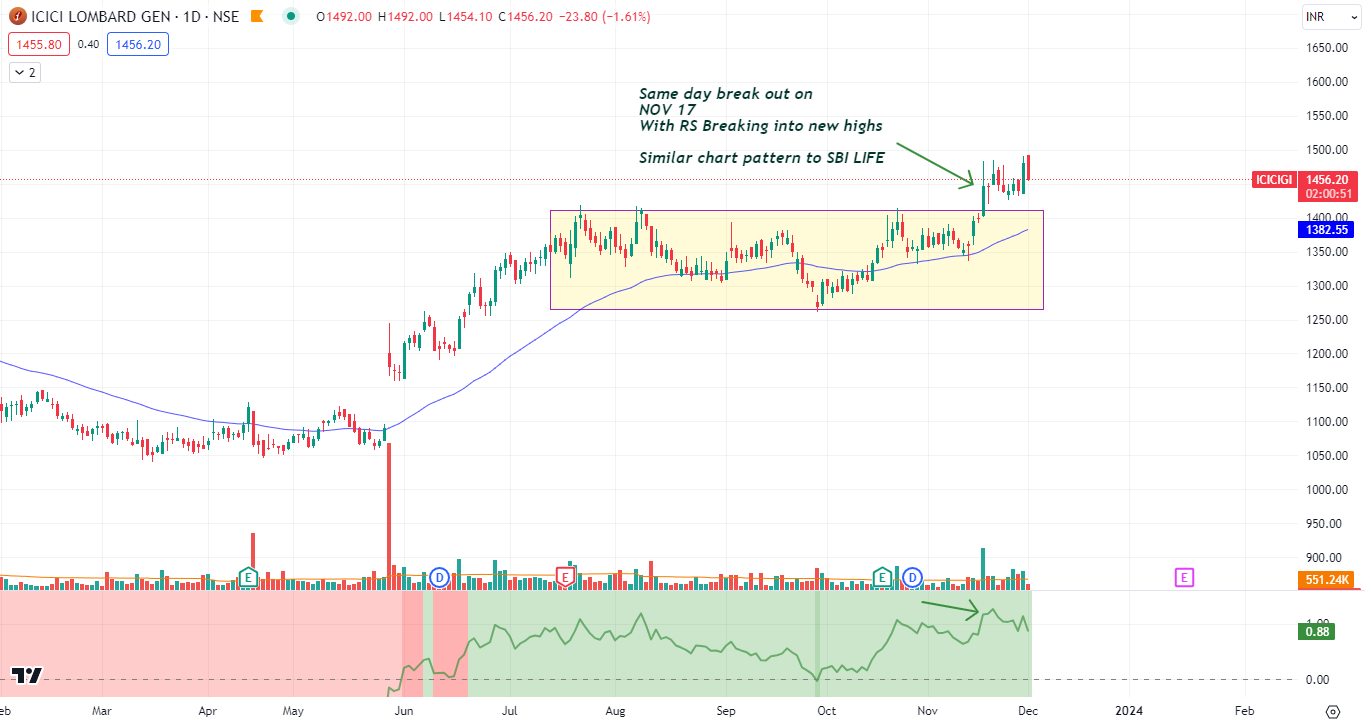
The stock broke out on the same day as SBI Life insurance with huge volume and rise in RS.
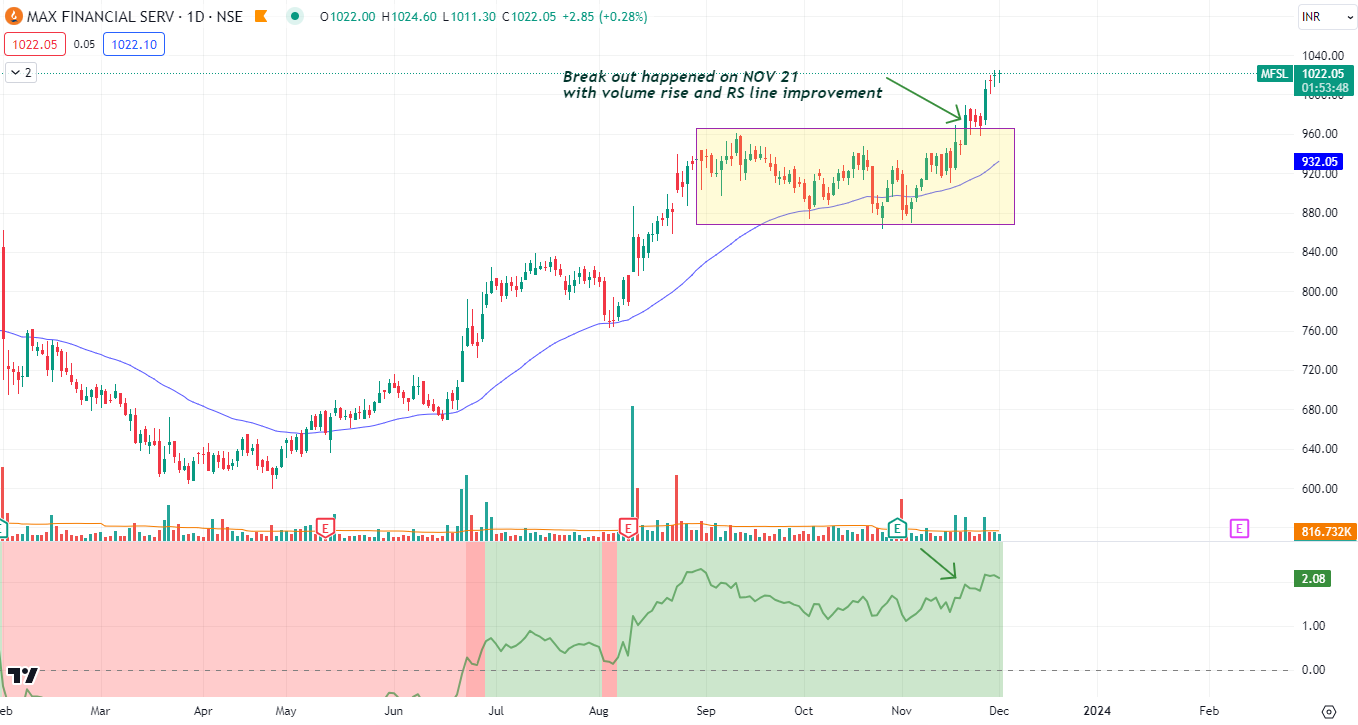
MAX FINANCIAL SERVICES:
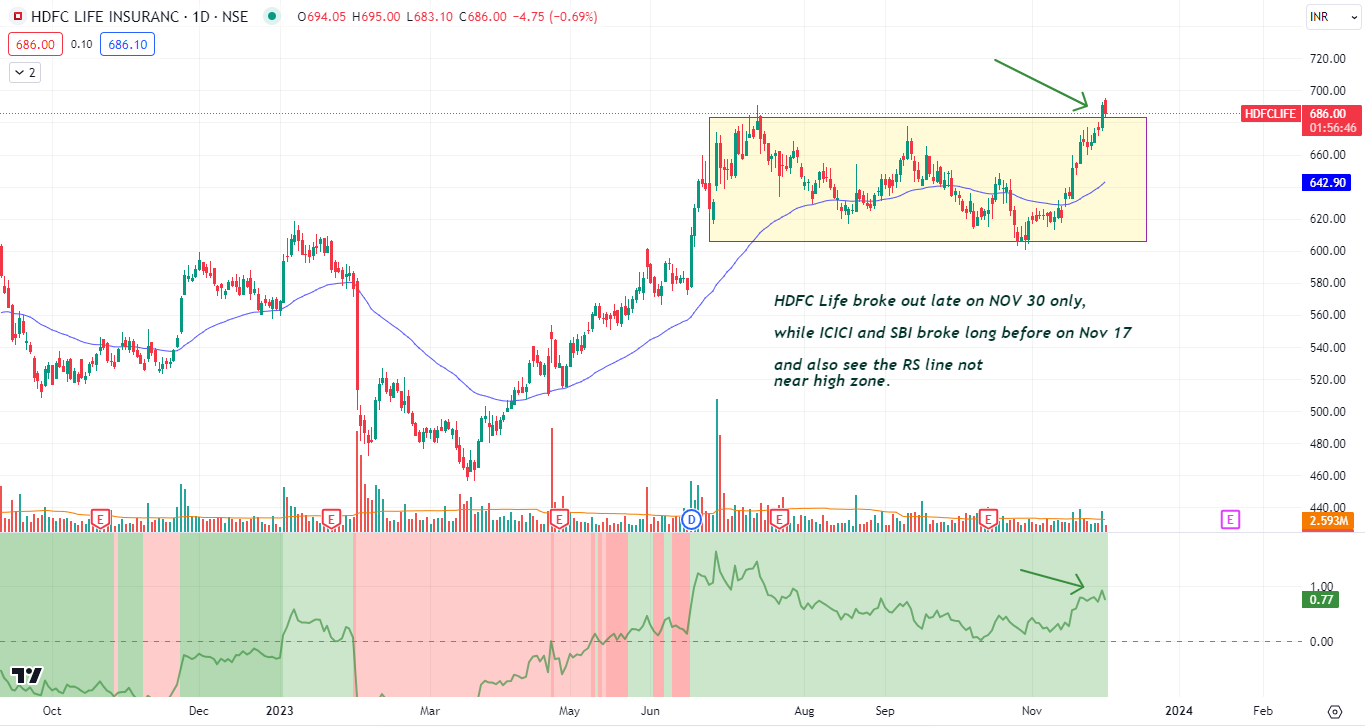
HDFC LIFE:
See somehow similar consolidation and breakout of HDFC Life. However, the stock is a little laggard when compared with the above stocks, since the breakout happened later and also see the RS line in downward slope as opposed to the above stocks.
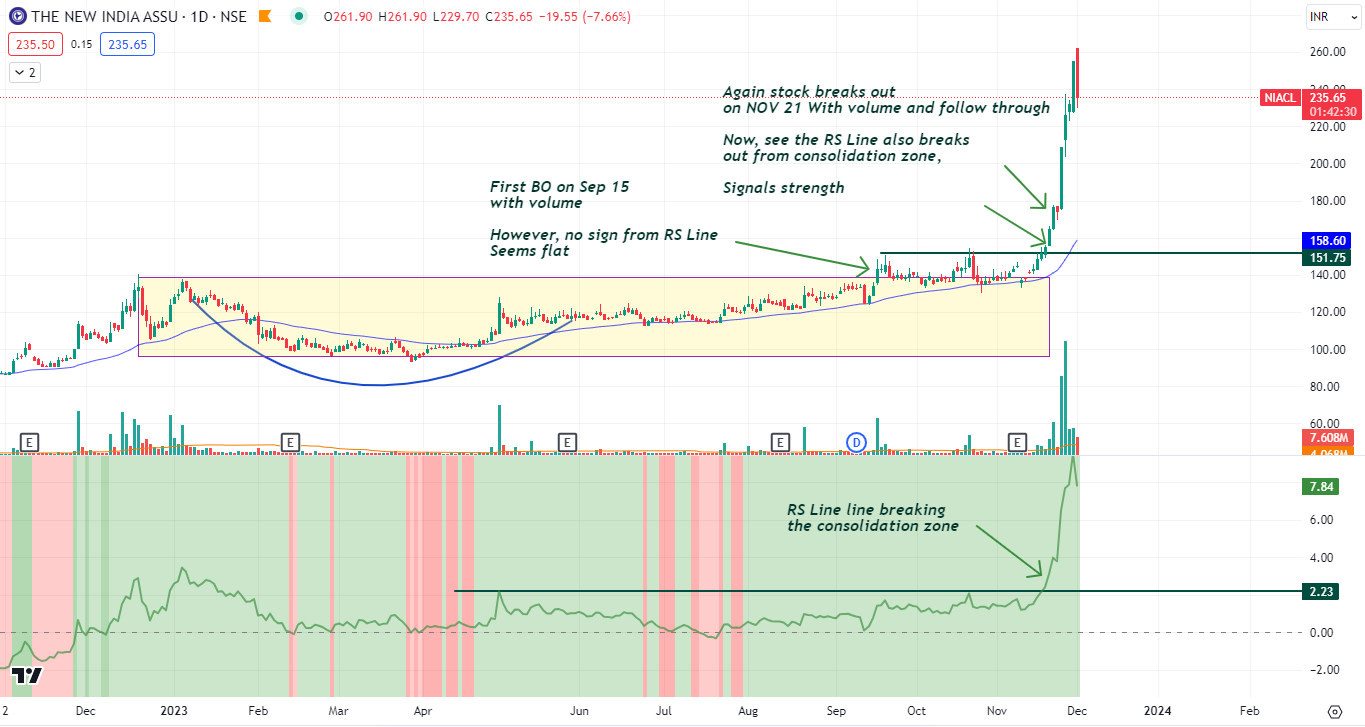
NEW INDIA ASSURANCE:
Another company that showed tremendous performance after the NOV 21 breakout was NIACL.
See the chart below:
The first breakout happened around SEP 15, later the stock went into a box over box consolidation and on NOV 21 it broke again. See the move !!! Really don’t know what happened here.
Takeaway Thoughts:
This is how I analyze sister stock movements.
But, if you are thinking which stock one should have gone behind, that is where the experience plays a role. Even if, one is not experienced one can have some set of rules to filter out strong names, among these stocks showing similar patterns.
I always prefer stocks that are trading near or near to all time zones. I don’t want to trade stocks which have too much congestion on the left side of the chart. It does not mean those stocks won’t perform. They can. But, I just want to focus only on limited names.
Also, I prefer going behind stocks with superior RS strength. I had written an article on how to find these dark horses using relative strength lines. Read it to understand fully. Also check out my free position sizing calculator to decide how much of stock you can buy as per your risk appetite.
Let me remind you all again – KINDLY do your own research before investing / trading in any of the stocks I talk about. These are just for study purposes only.
If you like my article, consider subscribing to my newsletter, so that my articles reach you straight in the inbox.
Happy Investing !!!


2 thoughts on “How to Analyze “Sister Stock Movements” Like a Trading Wizard !!!”