 by
by Hi all !!!
In this article, I am going to share my insight on why one should be expecting a huge volatility ahead and why one should wait for the right time, if he/she is planning to bring fresh money into the market.
These articles are a means of affirmation for myself. And I share these articles to my fellow readers, just like I talk to my colleagues (about my profession). Kindly don’t consider me as an expert or some guru. I am just a trader / investor like you. I make a lot of mistakes in trading. You can see my trading journals here.
Writing what I do (including my shortcomings) has helped me a lot in improving my trading skills, as it gives me more clarity.
Hope you all are clear on that point.
In this article, I am going to share a few points how INDIA VIX has been changing in the past few months and how gradually it has become stronger day by day. Also I will share some insights on why bringing fresh money into the market might be a bad decision.
I had already written an article on negative correlation between INDIA VIX and the Broader market index. And how one can benefit from it by using relative strength. If you are new, I will suggest you read that article before proceeding, since the basics are covered over there.
Analyzing India Vix price action:
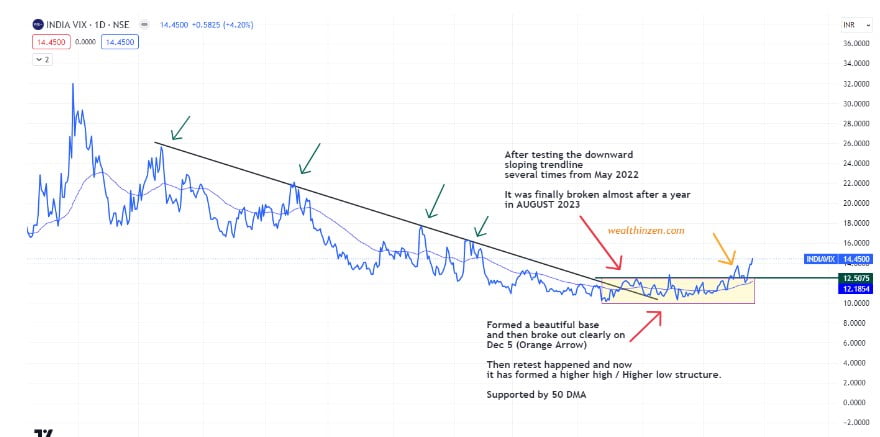
First before analyzing the relative strength of INDIA VIX, let us see the price action of INDIA VIX. I had plotted a line chart as it gives more clarity than the candle chart. Candles in VIX are highly volatile and confusing.
See the chart below:
As shown in the above chart one can see, for how long the VIX has formed a Stage 1- price structure and broken out strongly. I agree that every breakout is not that important or at times confusing. But, when such breakouts happen after a long time with good consolidation then it should be considered.
Analyzing VIX with Relative Strength:
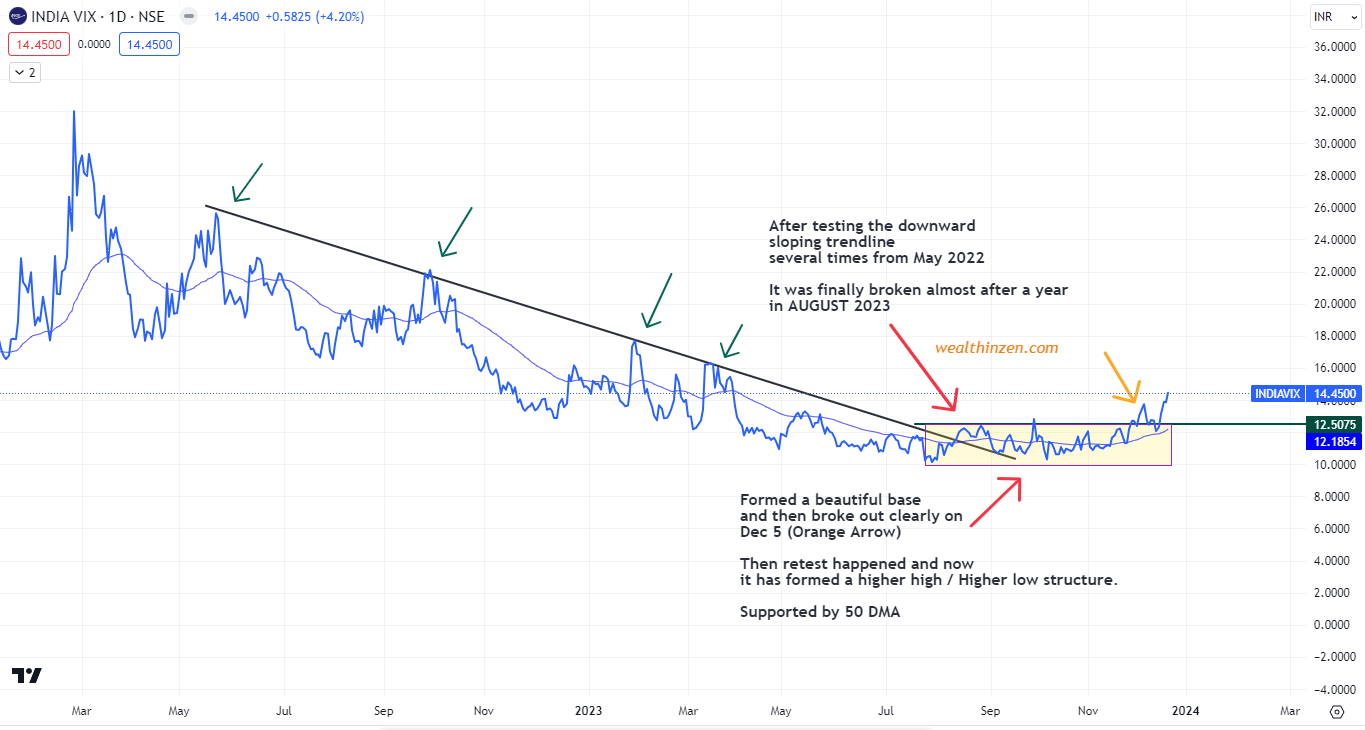
The performance of VIX against Nifty 50 shows a much worrisome picture. I had already explained in my article “ Finding the dark horse using relative strength” on how one can find the emerging strong candidates, well before the move happens.
See the picture below:
You can see that when the VIX formed a new low pivot in DEC 2022 at POINT A, the relative strength also went to form a new low pivot at Point 1A.
After that, INDIA VIX kept on forming lower lows till AUGUST 2023. It formed a new low again in AUGUST 2023 at POINT B. But, at the same time, see the relative strength line. It didn’t break the previous pivot and held high at POINT 1B. This tells that even though VIX was going lower, its performance against NIFTY 50 kept on increasing strongly.
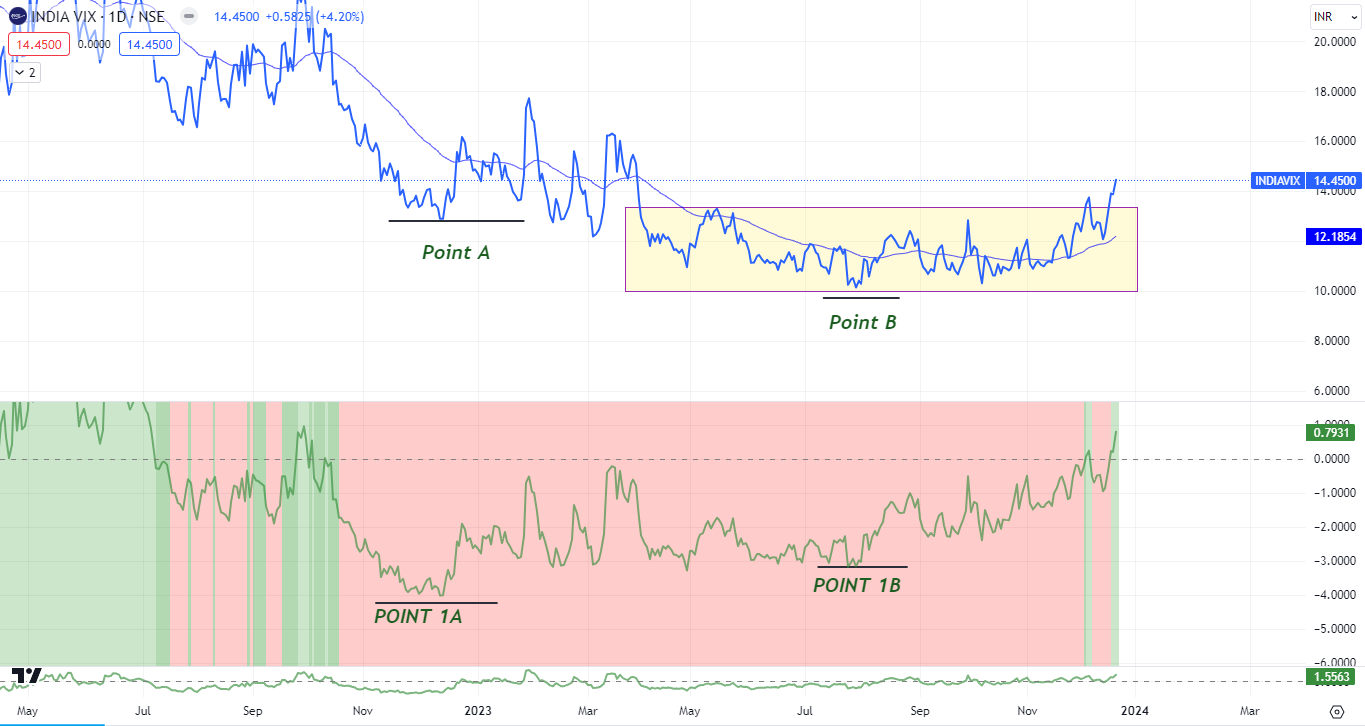
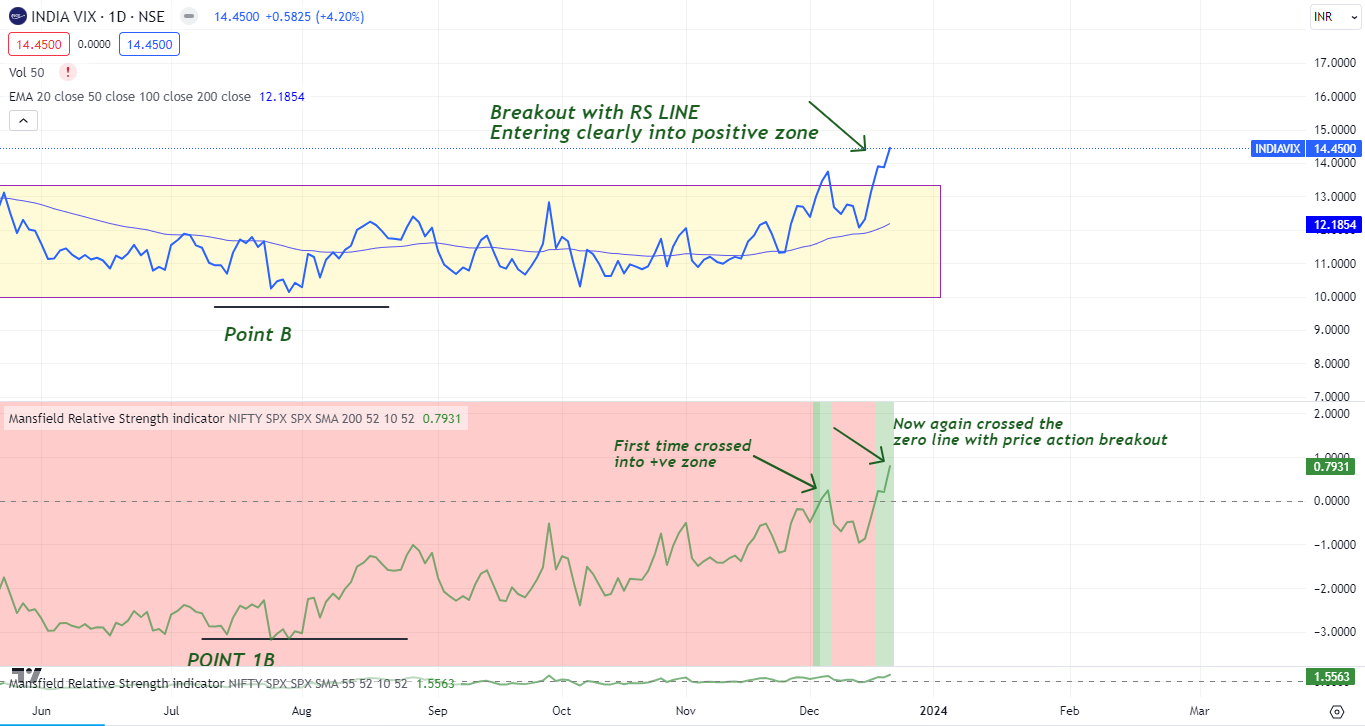
Zero line and INDIA VIX:
Whenever, the relative strength line crosses into the positive zone after staying in the negative zone for a long time (here almost a year or more), it gains significance.
See the image below:
What should one do?
Though we are in a long term good structure and markets are likely to continue the uptrend in coming months, turbulence is definitely there. Also, see how NIFTY has risen to new highs with strength. Some cool off will be needed before the next move. But one can’t predict when that cool off can come exactly.
What I am doing right now is – I don’t bring any new money into the market. I am just trailing my existing positions as I am completely scaled in and will sell them in case it meets my exit criteria.
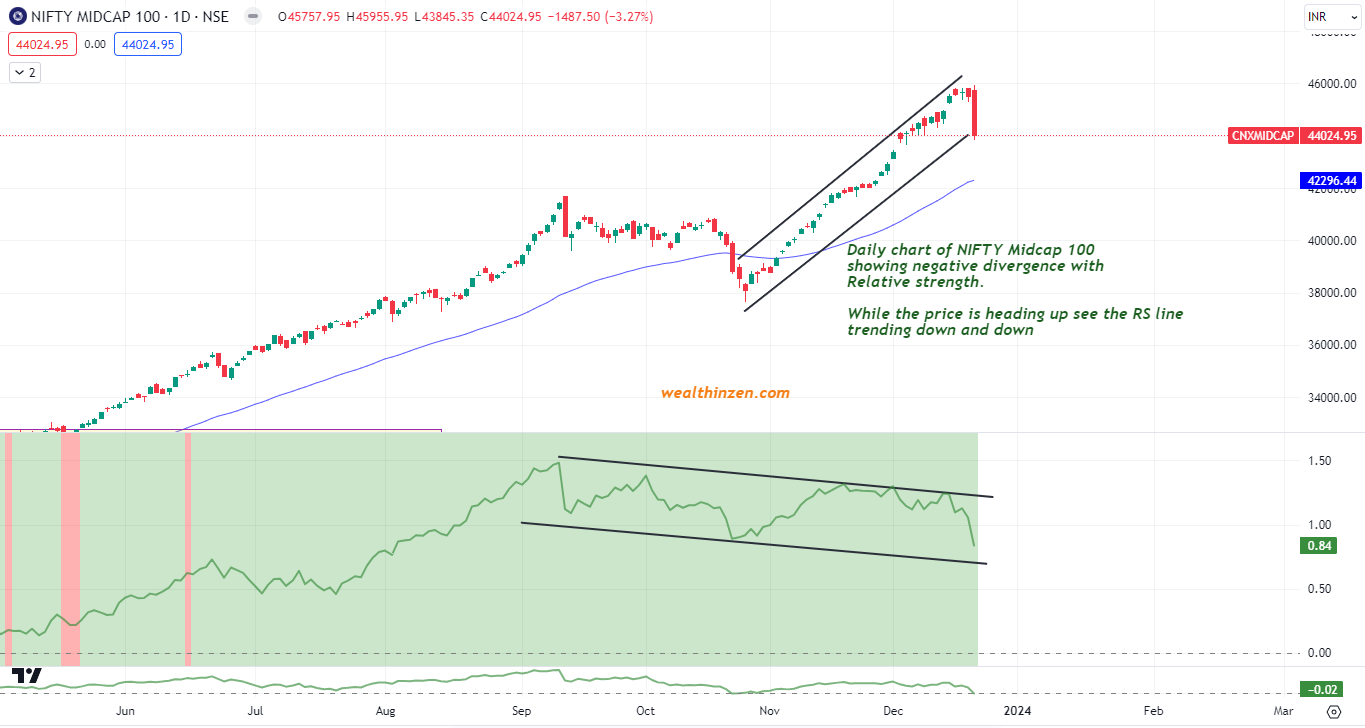
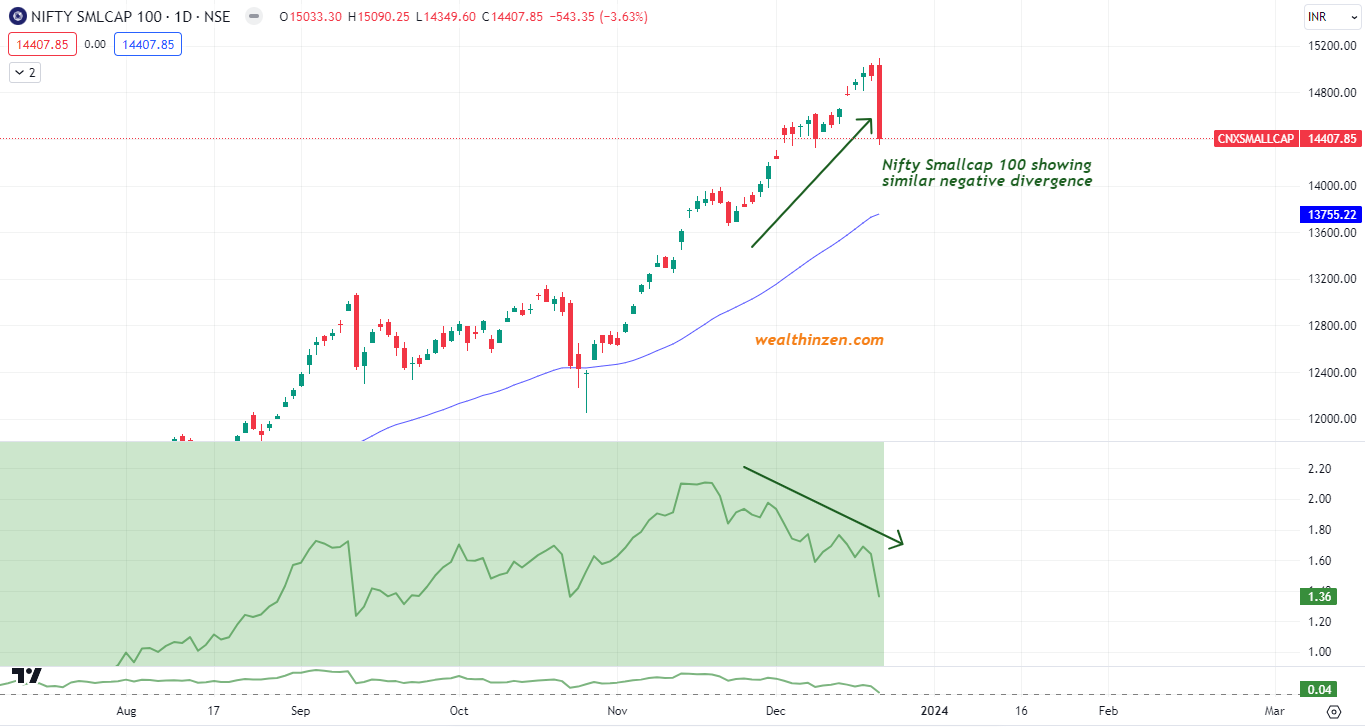
One more compelling point to stop bringing new money is the negative divergence I see between the Relative strength line of Nifty Midcaps and Nifty Small caps against NIFTY.
See the charts below:
Nifty Midcap:
Nifty Small-cap 100:
I had written an article on how to gauge the market breadth using relative strength line earlier. Do read it if you want to understand what I mean.
Final thoughts:
I have just given my perspective. You can completely disagree with me and the market can also prove me wrong. So, always stick to your way of process.
If the market starts turning down, just exit the positions as per your sell rules. Exit if it violates the previous pivots, breaks the moving averages etc., It all depends on what you practice. Just stick to it.
Or if the market keeps moving up, just enjoy the ride. Don’t preempt anything.
But just wait if you are bringing new money. That’s it. Buy LIQUID BEES as of now and then when the time is ripe, pounce on it. Looking for stocks during dull markets is an art and we all should develop that skill.
Happy Trading !!!


One thought on “How to predict the Volatility in Stock market using INDIAVIX?”