 by
by What is India VIX?:
India VIX also known as Indian Volatility Index is a concept introduced by NSE in 2008 though it was originally introduced way back in 1993 in Chicago Board Options Exchange. The India VIX represents the volatility of the stock market and it helps traders to understand what is going on in the short term. India Vix has a direct negative correlation with the Nifty Index historically.
In recent times, the stock market has corrected a lot and has given jitters to both the investors and traders alike. While investors are panicking seeing their portfolio in red, traders are frequently stopped out and trades are not working in their favor neither on the short side nor on the long side.
Shake outs have become very common and it has shattered the confidence of a lot of traders. Particularly the new traders who have come into markets post dip of Covid 19 are now starting to see the reality of the stock market. They were till now enjoying the never stopping bull run which has come to an halt.
But, we cannot stop learning right? In this article, I had tried to explain how India VIX can be understood better with relative strength aspects and how one can make safe bets as a trader. I will try to point out some ideas for long term investing also.
Relative Strength and India VIX:
Relative strength is the strength of a particular stock or a derivative or commodity in relation to the bench mark. It is calculated by dividing the price of that particular stock by the benchmark value. Higher the resultant value higher is the relative strength and Vice Versa. It is calculated on a daily basis and is smoothened out as a 120 / 180 / 200 Moving averages. Negative values are plotted below a Zero Line and Positive values are plotted above a zero line.
We already know that India VIX has a negative correlation with Nifty. So, if the performance / strength of India VIX is greater than the Nifty 50 benchmark then we can consider that Nifty is in a downward movement or a consolidated movement. The vice versa is also true. To understand this aspect let us see what happened during Covid crisis.
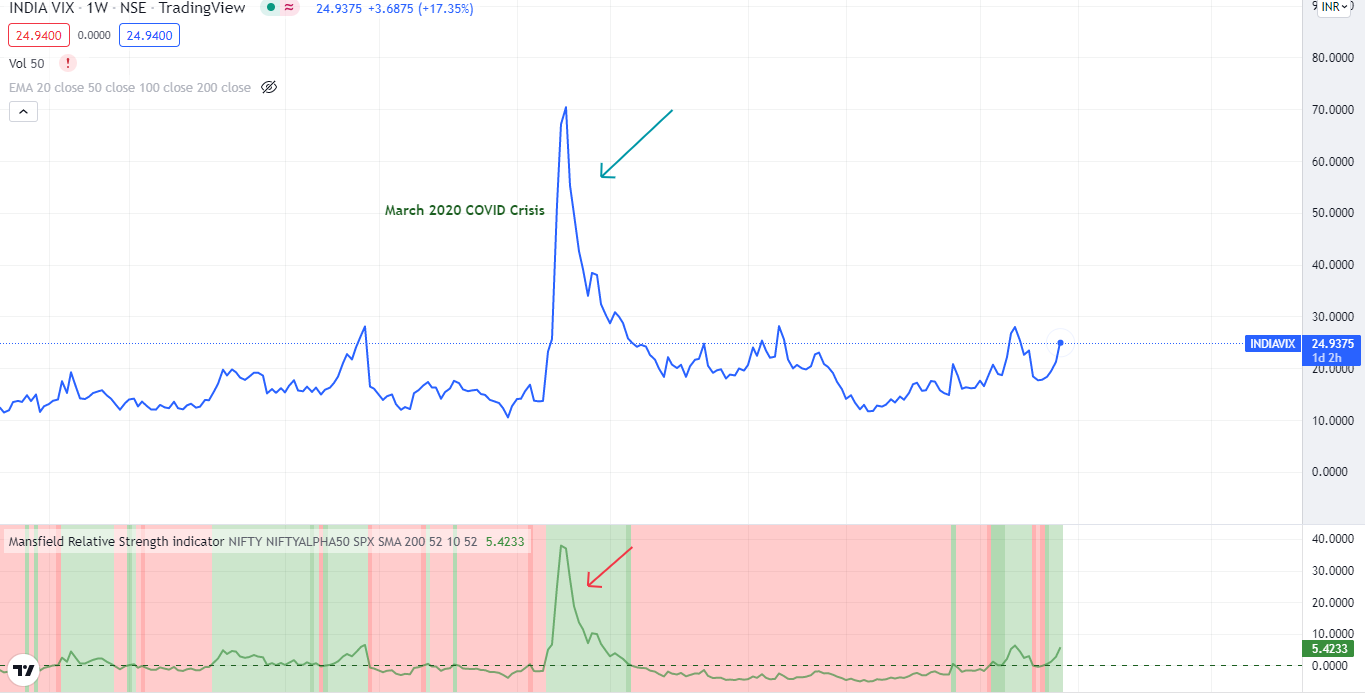
During the Covid crisis the VIX rose to a staggering level of 70 with Nifty moving down by 40%. The Relative Strength of the India VIX also went above the zero line (shown in red arrow).
Why do I need to use Relative Strength for VIX?
One may think that “When I know that Indian VIX has a negative correlation to the indices, why should I check the relative strength?” Historically the VIX value when stays below 20 is said to be good for the market while anything above it can cause a down move or an unexpected move in the short term.
However, can we just exit out of the position just because VIX has crossed 20 or more. That would not be a good idea. Just exiting the positions, when the Indian VIX crosses a particular level can lead to severe whipsaws and one will be easily shaken off.
To prevent these whipsaws, we should be a little certain that something bad is really coming. Though there may be many ways like predicting global markets impact, Seeing Advance / decline ratios etc., the relative strength of Indian VIX plotted against Nifty 50 or any other benchmark as per your criteria can give you a deeper insight of what is happening in the market.
For this, we have to see how consistently the Indian VIX is hovering above the Zero Line in the relative strength. Zero line is calculated by taking the average of India VIX / Nifty 50 for a specified period. In our examples we have taken 200 days. In Indian context this Zero line is rightly called as “Lakshman Rekha” by Mr. Premal Parekh. (Mr. Premal Parekh is an Indian Investor who is an expert in selecting stocks based on Relative Strength. He is practicing Relative Strength for the past several years and has dedicated his life to RS based stock analysis).
If the Indian VIX/ Nifty50 stays above the Zero line for a long period of time it means the market is in trouble at present. You can see in the current context that Nifty 50 made its All Time High on October 19 -2021.
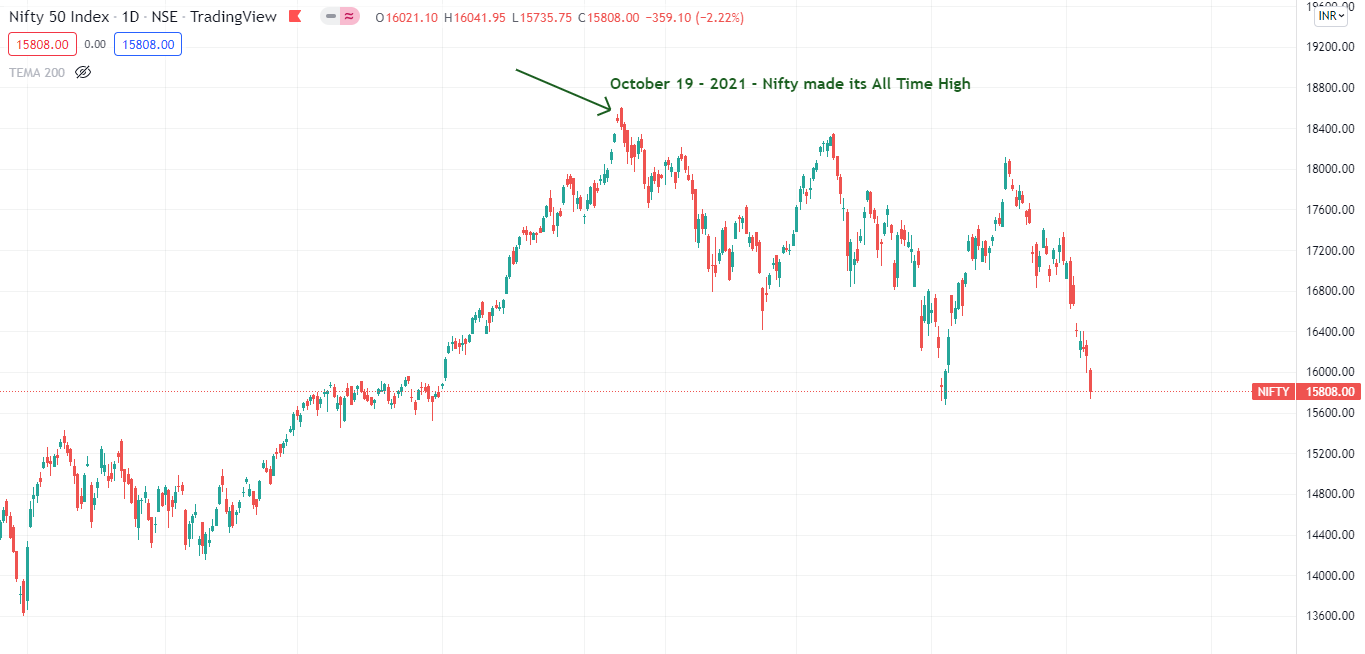
From that day Nifty 50 started to make a consistent Lower Low and Lower High till date (12-May-2022), roughly for a period of seven months. Below is the chart of relative Strength of India Vix plotted against Nifty 50 for a period of 200 days:
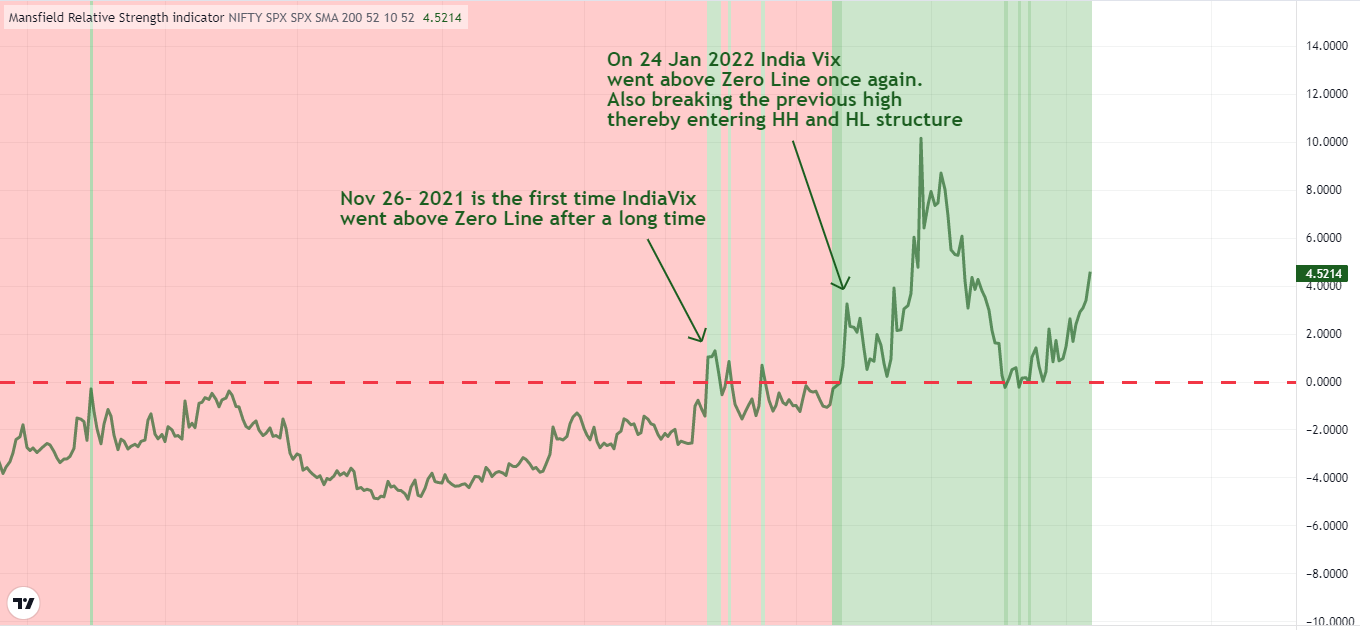
If you notice that, on Nov 26-2021 itself the Relative strength line has crossed the zero line. However, when we have big positions we just cannot sell our positions, just because the indicator indicates so. After that crossover, the Vix RS hovered around the zero line for some time and on Jan 24 it started to go past the previous high, indicating a shift in the market sentiment.
This should be taken note of very seriously and one should be cautious of the position one has.
So, What Should one do now?
Well, though I cannot decide which is best for you, I will share what I will be doing in such a situation. I will divide this part into three categories:
- Swing / Short term Traders
- Passive Long term Investors
- Active Long term Investors
Swing / Short Term Traders:
If you are a trader, who takes part in swing or short term trades, completely avoid your trades. The volatility is very high and you are bound to get your Stop Loss hit very often. This will hamper your confidence and the worst part is if you are already trading successfully by following a system or a rule based trading, it may make you doubt your system / strategy.
Till you see higher high, higher low structures in Daily Time Frame and India VIX goes below the zero line and starts to stay consistently below it, stay away from all types of trading.
However, if you know options you may have some wonderful opportunities in short term. But, be sure that you are nimble enough to manage your position, if you are a options seller in particular.
Passive Long Term Investors:
If you are a passive investor who invests in the mode of SIP in some mutual funds or in index funds, this is a golden time to invest more, provided you are pursuing a long term goal not less than 5-10 years.
The markets are still in a long term uptrend only and the recovery may happen anytime soon. (Nobody can predict when) Longer the time taken for recovery, higher will be your benefit because once the recovery starts the market will go up in full swing and you will be surprised to see the power of compounding then. But, don’t forget to rebalance your portfolio when the market is giving you fantastic returns. That is why it is best recommended to have a debt fund as a part of your asset allocation handy.
Active Long Term Investors:
If you know about stock markets and how to pick stocks, then this is the time to look for stocks which are falling less when compared to the market. If the market falls by 20% and your stock has fallen just 10% then you are holding a fantastic stock and the relative strength of the stock is said to be good. Also, you can use this time to clean up your portfolio, by removing worst performing stocks.
Even if you don’t hold such a stock, this is the time where you can shortlist some stocks with superb relative strength and keep them in your watchlist. Once the market recovers and the India VIX also settles down and its relative strength goes below the Zero line and stays there for a considerable duration, you can start bringing your money with calculated bets and gain a lion’s share.
If you are a beginner and don’t know how to pick your stocks without breaking your head, read my article on “Stock selection for beginners – Four easy ways”.
Key Takeaways:
- India VIX offers a way to see how the market is going to perform in a short – intermediate period of time.
- Relative Strength of India VIX plotted against Nifty 50 is a better way to evaluate our analysis and take informed decisions based on that.
- When the RS stays above the zero line for a consistent period of time, it is a sign of weakness and lack of confidence among investors.
- While short term traders should avoid trading completely or at least reduce their positions considerably, Long term investors should use this opportunity either to invest more or to pick stocks and create a portfolio based on RS or their own strategy.


3 thoughts on “India VIX and Relative Strength Correlation – How to play in Short and Long Term? (An Analysis)”