 by
by THE REASONS :
The market is down by 15% and there is panic everywhere. Media is very happy, as it is the down move in the market that keeps them very busy. If the market is normal media houses don’t get any news. Once the market goes into drain then all sorts of negative news comes into play:
- Russian Ukraine war,
- unemployment ratio,
- increasing oil prices,
- inflation,
- Interest rate hikes by the Fed are all said to be the reason for this down move.
But as a trader / investor who invests not based on news but on own technical and fundamental analysis, this news is not that much meaningful. In fact, in my opinion news is just a narrative of that particular person / editor / news channel / organization and nothing else.
The narrative may either be positive or negative depending on who interprets. So the news carries an intrinsic bias in itself.
For the same reason, technical analysis has a slight higher place in my investing journey than fundamental analysis as the former has less intrinsic bias. A fundamental analyst always takes a position based on the macro and micro analysis which is again nothing but a narrative, he spins over the knowledge he gains from analyzing the particular stock / Company. Kindly, understand that I have great respect for the fundamental analysts. But, pure fundamental analysis is not my cup of tea.
I strongly believe that ” Seeing is believing”. I believe what I see in charts. So, in this article I try to give an insight of what has happened in the past and what is happening right now in the market and how much down move we can expect in the coming days and how we can adapt ourselves to the situation.
Past performance of Sensex after a crash:
Now, the most common thing we hear today is that “ It is unusual for the market to experience two crashes within a very short span of time”. This statement is definitely true to some extent as we had not witnessed two crashes in such a short span for the same reason. However, the media is projecting that there is a possibility of a crash in the near future. Several reasons are being said, increasing the distrust among the investors.
In a long term bull run, corrections of 20-30% are very common. Let us see what happened in 2010 exactly two – three years after the Lehman brother’s crash.
See the chart below. All the charts are monthly charts and the source is from TradingView.com
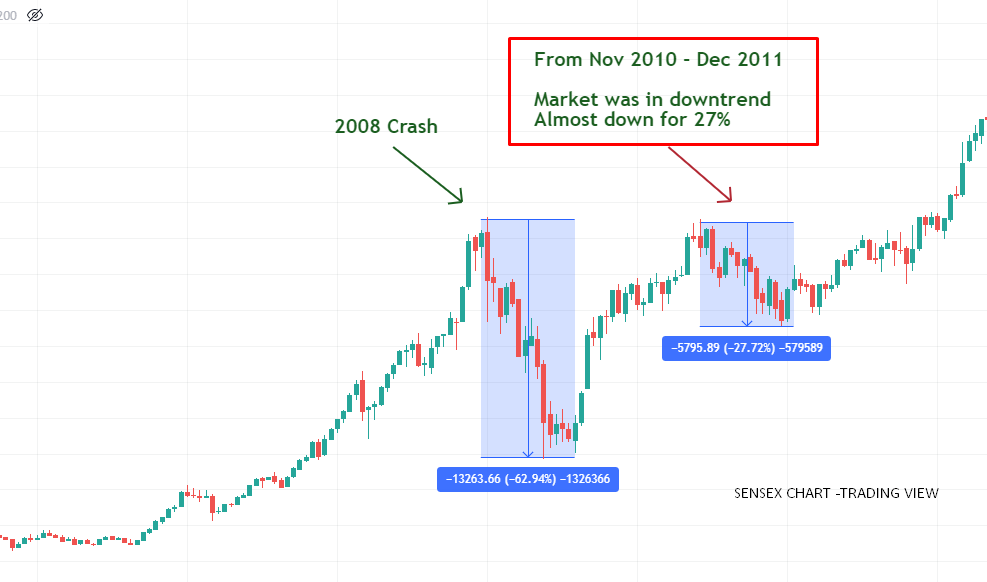
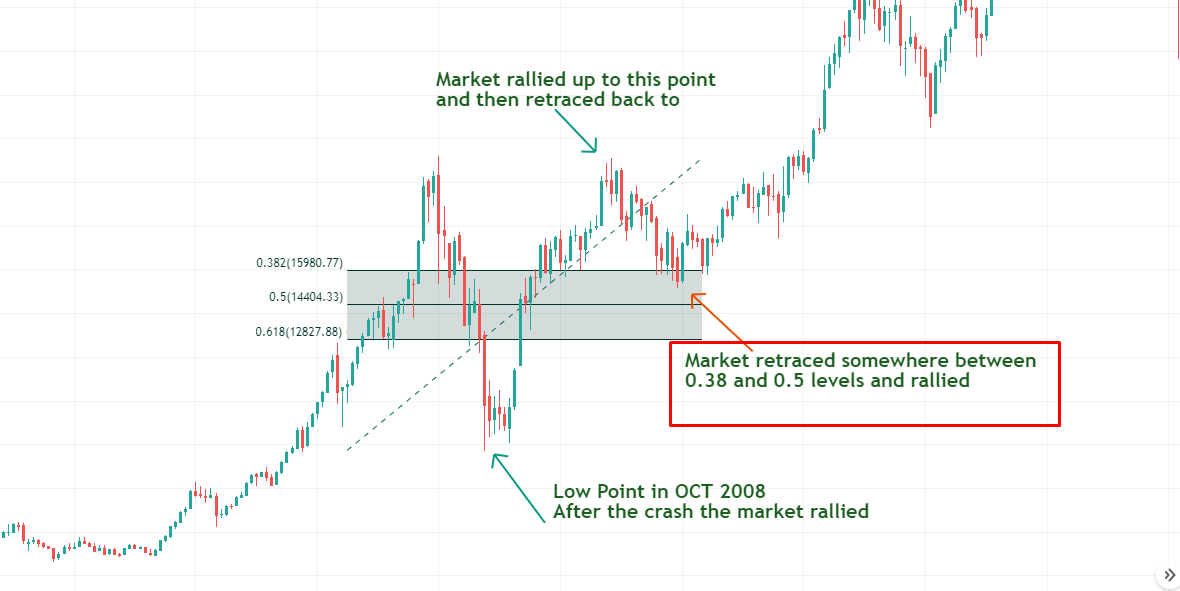
The market recovered from the fall in 2008, but after a fantastic rally up to 2010, it started to correct and it was down by almost 27-28%. The news at that time would also been recession, inflation etc., But see the recovery, after a long consolidation, the market recovered and went on to make a new high.
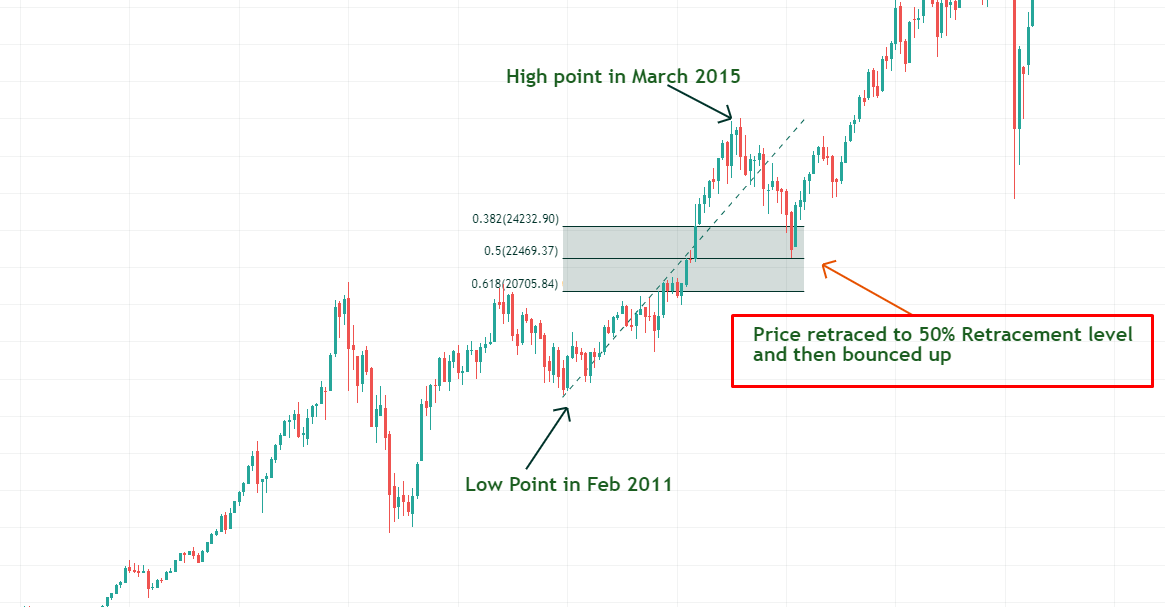
Similarly, in 2015 sensex after making a new high went into downtrend for another one year. See chart below:
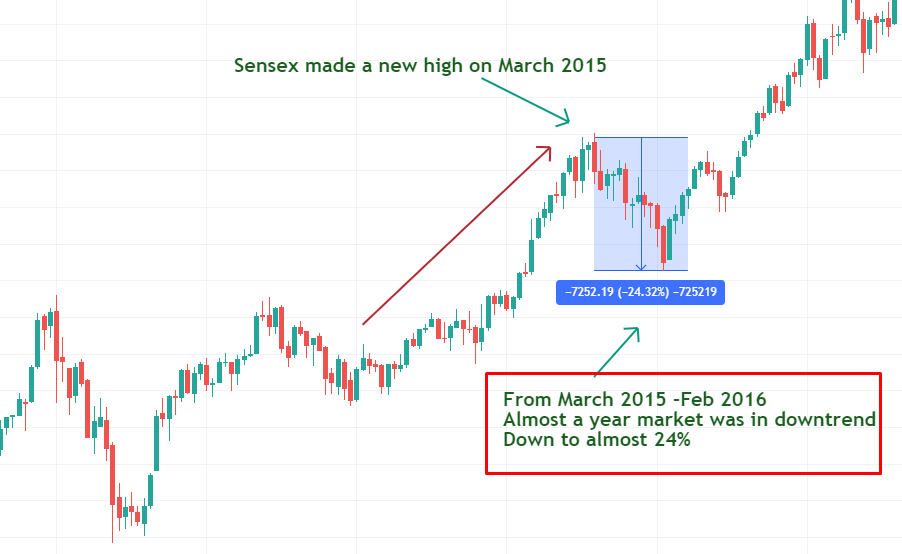
After 2016 the market again went on to form a new high. So, whether a crash happens or not in a bull run, market taking a breather here and there for a year or two is very common. Also, if we see the chart as of today (May-20- 2022) we are just down to 15%.
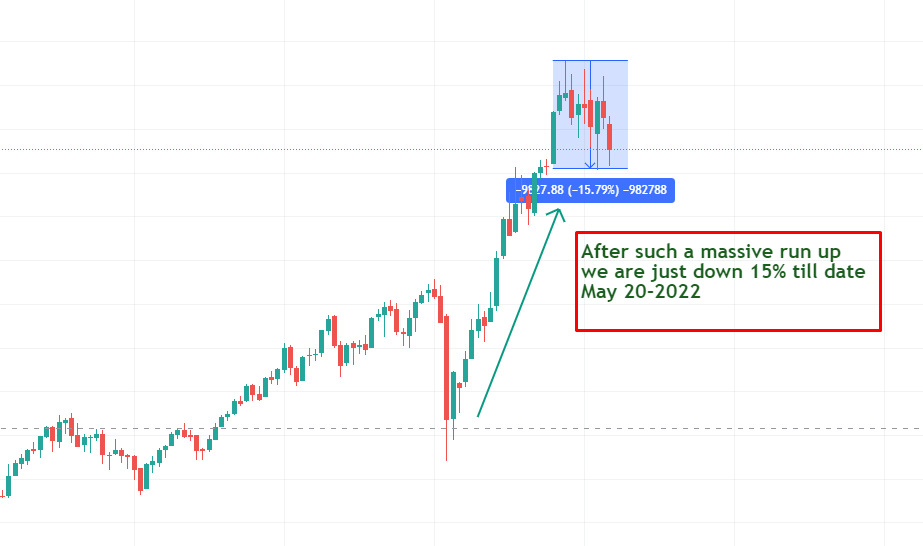
We are worrying just for a 15% down correction after a massive 137% up move. So, am I saying that there is no way the market can go down any further? “ NO” , I just say that “I feel this correction is much needed for a healthy market to emerge and the froth to be corrected.”
Also, could there be a massive crash? Yes it could very well happen. But, all I am trying to say is the market is in a very good structure and I don’t feel anything bad till date. Of course, I keep the news aside and take it with a pinch of salt. I am just focusing on the chart structure.
How much down-move can we expect?
Well, that is definitely going to be a guess. But, even guessing can be sensible. You can guess with logic and expect things to happen. I am a firm believer of Fibonacci numbers. Fibonacci numbers are found everywhere in nature – the petals in flowers, vegetables, honey comb, Human facial proportions, Human teeth and so on.
Nature itself has integrated these fib numbers in our lives. Then why not interpret the market with these numbers? Let’s see how we can guess with this logic. If you are new to FIBONACCI Retracements in Market analysis, kindly google the basics.
In technical analysis, retracements to these FIB levels are important. Usually, the retracement occurring to the levels of 38%, 50% and 61% (0.382, 0.5, 0.618) are the things I am concerned about. These levels may vary for different traders.
First, we will see how it fared in the past.
Below is the chart of Sensex in 2008 – 2011
Similarly after that in 2015 reaching a new high retraced back to 50% level and then rallied up:
As we had seen these retracements in the past, let us see what is happening right now. For easy understanding of the levels I am taking Nifty monthly chart for this. See the chart below.
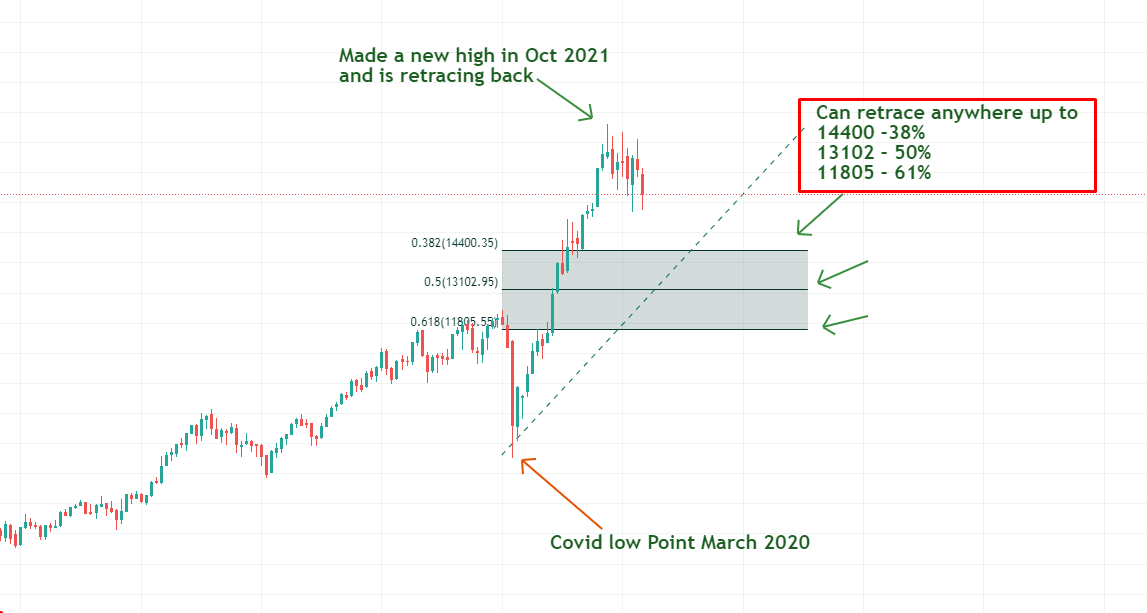
The market is down by around 15% and it has all the probability to retrace back to any of the FIB levels- 38, 50, 61%.
So, what do we do now?
We don’t know how much it will retrace back and from where it will start to rally. But, the market has always been in an upward bias. And its structure is intact and is in a fantastic long term bull run. My take is this is a golden opportunity for the long term players who keep bringing their hard earned money in tranches or in the form of SIPs.
Selecting good stocks and doing Systematic Investments may reap good benefits. But in the short term you may feel depressed as the market may be in a consolidation mode for two to three years or even more. Who knows? But eventually these are the periods where you would have built a good corpus. The corpus you build now will be adding up and once the market starts its upswing you will be surprised to see the effect it will have on your portfolio.
If you are a passive investor who doesn’t know much about markets, start investing in index funds or if you want to invest directly in stocks, pick stocks without breaking your head by these four steps, that I had written in the article.
If you are an active investor, you will have plenty of options in the times to come. Look for sector leaders, sector rotations, pick up the leading sectors, among the sectors pick up sister stocks (stocks which are similar to each other eg: Tata steel and JSW Steel in the metal sector), analyze their relative strength and gradually build positions.
I am using the word gradually because we really don’t know when the market is going to stop its down move and when it’s going to rally. Don’t get too excited with one to three days of rally. Wait for a monthly rally. A strong monthly close, breaking the previous month’s high is a very reliable indication of reversal.
We all hope for a better future and let all of us have a great investing journey.
Disclaimer:
The levels marked are based on my personal assumptions and analysis. As we always know, the market is a collective response from all the people involved in it. The market may rise from tomorrow itself to a new high not even touching the 38% FIB Levels. That is completely possible. Or the market may not stop even at 68% FIB level and may go further down. Whatever happens, I will take note of it and will act accordingly. My write up is my view only as of today. Kindly, do your own analysis before making any decisions. Thanks for understanding.