 by
by Hi all. Hope all of you are doing good. Markets are in a broader sideways movement from the time the Nifty topped in October 2021. Nothing has changed much till then and the sideways market has really made the traders frustrated for quite some time now. However, recently broader markets are changing really fast and NIFTY is again attempting to move into the ALL TIME HIGH zone. It is high time a good trader or an active investor should start taking notes of these subtle developments.
But, how can one be confident that the broader market is going strength to strength and all is going to move up? Is there a way to find out? Yes, one can do that by using relative strength. This is what I am going to discuss in this article.
Relative strength – A timeless Indicator:
Relative strength is the strength of a particular stock or a derivative or commodity in relation to the bench mark. It is calculated by dividing the price of that particular stock by the benchmark value. Higher the resultant value higher is the relative strength and Vice Versa. It is calculated on a daily basis and is smoothened out as a 120 / 180 / 200 Moving averages. Negative values are plotted below a Zero Line and Positive values are plotted above a zero line.
In my previous articles I had discussed how one can use the relative strength of India Vix against Nifty to gauge the market mood.
Also, in my another article I had explained how one can find the sector rotation easily using the relative strength. If you are a new reader I would highly recommend you to read them before reading further as some key data points are analyzed in those articles.
The uses of relative strength are many and my trading career has shifted from being stressful to stress free when I embraced it. Understanding the concept of relative strength gave me room to think in a different perspective and has helped to improve my trading career a lot.
If I want to describe relative strength and its importance in just two words, it would be “ THE TIMELESS INDICATOR” . It is timeless because it worked yesterday, works today and will work on any day in the future.
Comparing the Relative Strength of Small and Mid Caps with Nifty 50:
First let us understand what usually happens at the end of a bear market. Once the bear market starts to end or in other words the fall of the broader market stabilizes, money starts flowing into blue chip companies. Blue chip companies are the stocks in Nifty 50 that are too big to fail. Suspicious investors slowly start building their positions in Blue chip companies as most are unaware of what’s going to come.
But, as the market gets more and more stable then the money starts flowing also into the small and mid cap stocks. This is where the game starts intensifying. Confidence of the big players increases and makes them feel free to invest in relatively smaller companies.
These smaller companies have very high volatility (generally) or high alpha (only in bull markets). They are more prone to move relatively much faster than the broader market. So when the top stocks of Nifty Small cap and Mid cap start outperforming the Index Nifty 50 itself, one can safely presume that the market breadth is improving a lot. This is the logic behind the comparison.
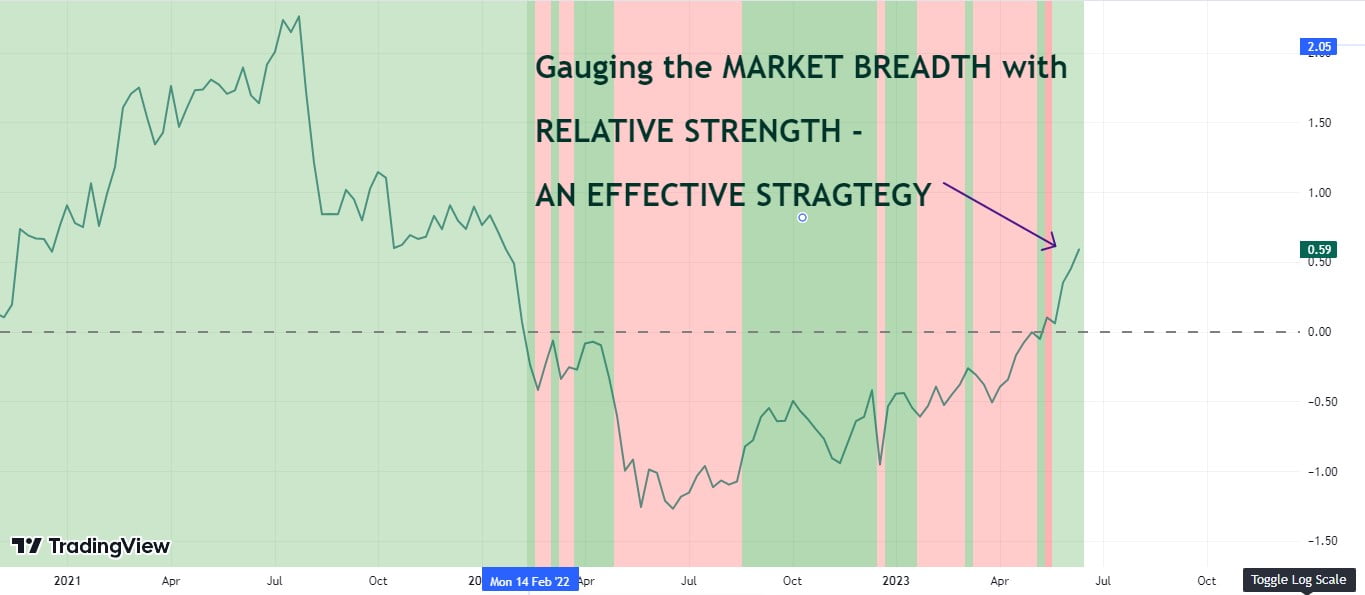
Gauging the Market Breadth Using Relative Strength Charts:
Now, I am going to show you some of the charts which will explain the concept we just talked above. Note, that the Indicator used is MANSFIELD RELATIVE STRENGTH INDICATOR by Ostapchester. Just search in the TradingView Indicator section and you will get it.
Also the charts below are of weekly Time Frame and the relative strength time period is of 52 weeks or in other words 1 year Time Frame. Our aim is to check the change in market mood from a long term perspective. So, I personally feel that this time period is more relevant. Playing long term has its own benefits.
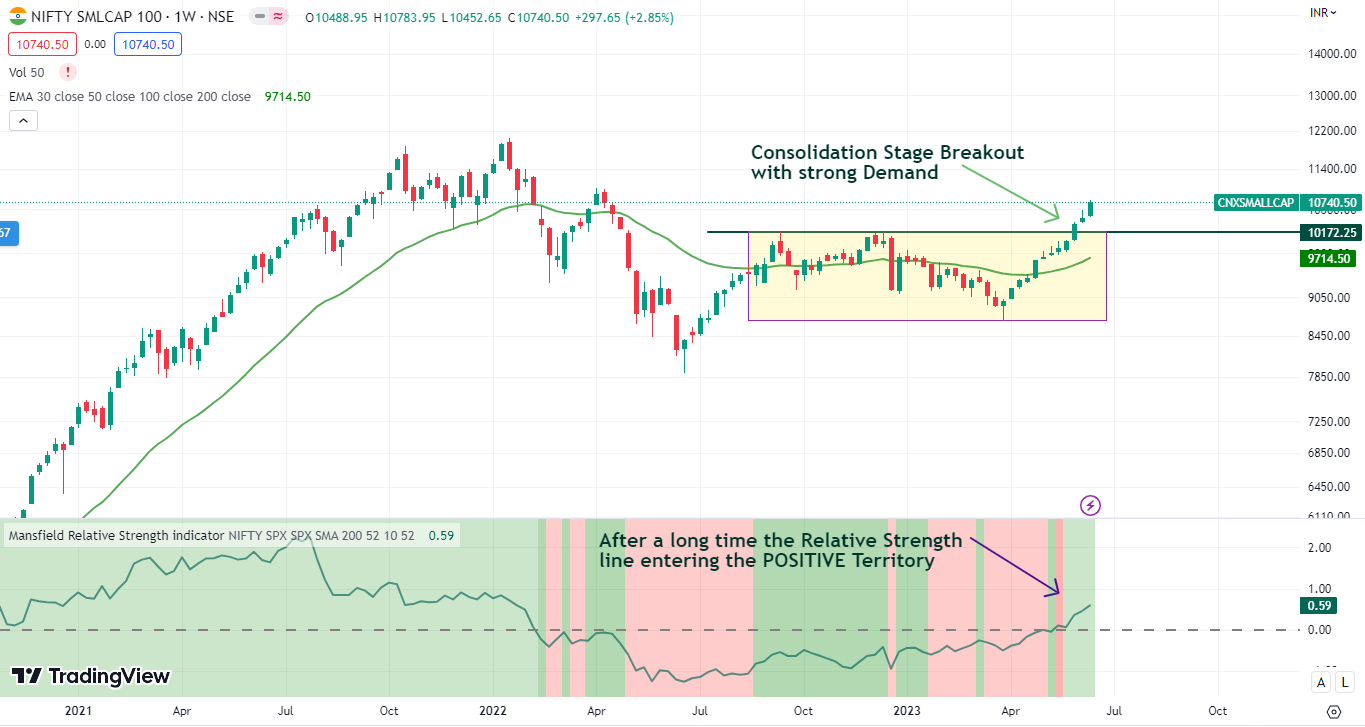
See the image below:
Weekly chart of Nifty Small Cap 100 showing tremendous strength and the Relative strength line (Blue Arrow) entering the Positive Zone almost after One and Half Years. It went down to the negative zone by Feb 2022, from that point it stayed below the zero line.
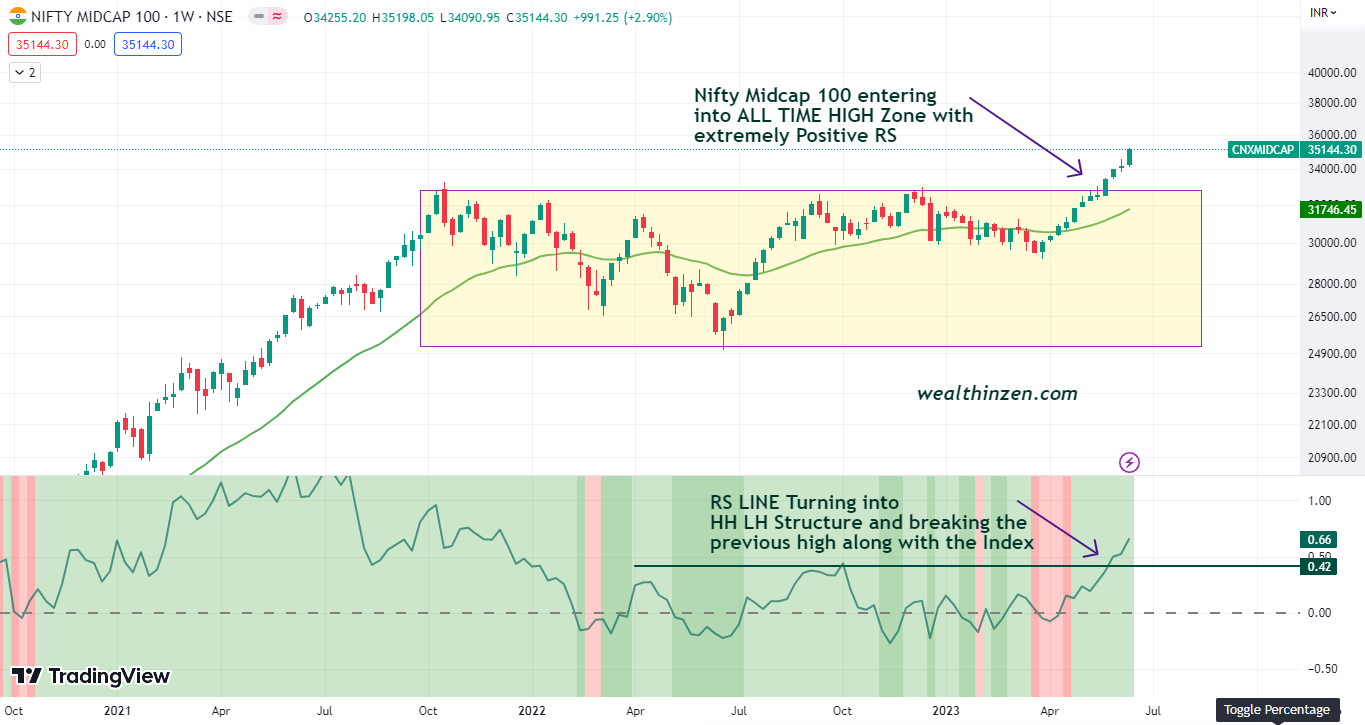
See the chart of NIFTY MIDCAP 100 Below:
After a long period Nifty Midcap 100 index breaks into ALL TIME HIGH along with a breakout in RS line:
Also, see the chart of NIFTY 500 entering into the ALL TIME HIGH ZONE with the RS line improving tremendously and entering into the positive zone.
When an index that consists of around 500 stocks outperform the Nifty 50, it only means that the overall market conditions are developing extremely well with bullish sentiments.
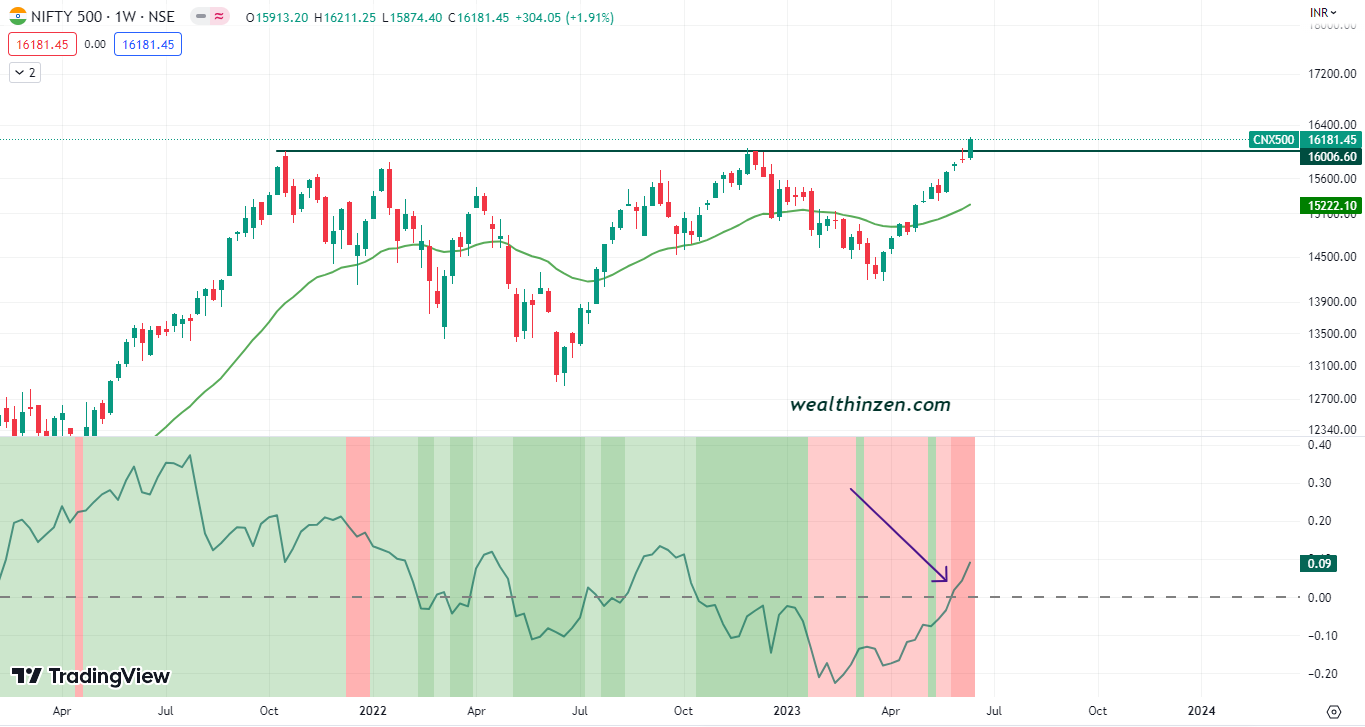
Such an out performing development should never be looked down on and one should be ready for the next swing.
Also, if you analyze some of the individual stocks in these indices you will see how many beautiful set ups are getting materialized and how many stocks has already moved into All time high zones. That is why, once the bear market sets in we should always be looking at the next opportunities that are going to come. I had written an article on how to prepare yourself for the next upswing when a bear market sets in. Read it, you will definitely know what I am talking about.
SO, What Next?
The market conditions have definitely improved in India. Global markets are also giving signs of improvement. S&P 500 is getting stabilized and turning into HH HL structure. NASDAQ also getting into fantastic structure. I always use these five key data points to get an insight on what’s happening globally.
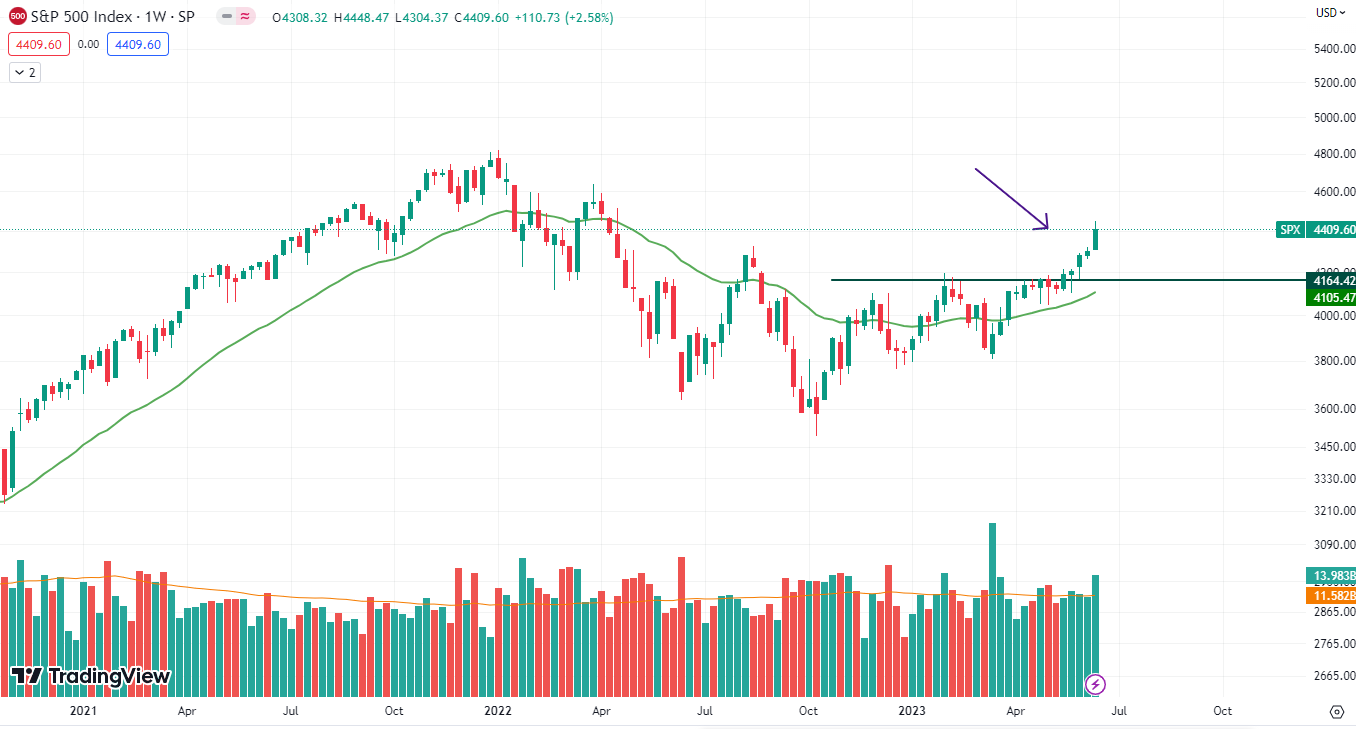
See the above chart. S&P 500 entering into stage 2.
However, we should exercise caution. We should always follow the risk reward concepts and do proper position sizing. Do remember that Mathematics plays a major role in your trading success. You can use my free position sizing calculator to determine how many stocks you can buy and how to build positions, based on your risk profile.
Build a concentrated portfolio with very strong names and hold it tight, till the trend ends. I had also written an article on how to select strongest stocks using relative strength. Hope it helps you in selecting stocks.
If you like my writing, consider subscribing to my Newsletters. This will enable you to see my articles delivered right into your inbox. Also, note that the points discussed above are my sole view on the market. I may be completely wrong in my analysis. Only time will tell. Always do your own analysis before starting to invest your hard earned money.
Happy Investing !!!

4 thoughts on “How to Gauge the Market Breadth Using Relative strength? (An effective strategy)”