
 by
by Well begun is half done – Aristotle:
As the above adage says, in every task the beginning is the half of that task. If one starts a work with a good beginning it gives them confidence and sets the path for the future. In the stock market, I consider that a good beginning starts with selecting good stocks to invest in. It may be a nightmare to select a few stocks in the vast universe of choices.
News, Social media, random suggestions from friends, screenshots of stocks getting set up for a big move, tweets like “ Don’t ever miss this multi-bagger”- make it even difficult to select stocks to focus upon.
What if we have a way to select the stocks without heeding to these random noises and follow a process, so that we can pin down some good stocks which may be a high probable bet? Yes, this is exactly what we are going to see in this article. I am going to share my thoughts on how one can pick stocks that will have an intrinsic advantage of moving to new highs, thereby increasing our account size also to new highs.
The article is written based on the current market condition, where it seems that after a severe fall in global markets, we finally see some turnaround. Only concern is the global trends which have to improve a lot in structure and it will take time. Always track these five key data points to predict the bottom formation and trend reversals. So, this stock selection method will be very useful after a bear market or even after a reasonable correction of index.
The top down approach funnel:
There are several ways to trade. The two most popular approaches are top down approach and bottom up approach. The former focuses more on the broader market conditions to take positions, while the bottom up approach has little concerns to the market environment. It completely depends upon the structure of the particular stock, one looks to trade, irrespective of the market condition.
While both have some pros and cons, the top down approach seems easier to use for me, as it tells us where the strong pockets of the market can be seen at any given time.

Also, in an earlier article regarding sector rotation, we had seen how the price movement of the stock is more dependent on the broader market condition. And to note further, the sector to which the stock belongs contribute the highest for the price movements in the stock. 49% of the price movement of stock is caused by the sector itself as per the study by university of Chicago.
(SOURCES: THE NEW SCIENCE OF INVESTING BY DR. ROBERT HAGEN, AND THE LATENT STATISTICAL STRUCTURE OF SECURITIES PRICE CHANGES, BY BENJAMIN KING).
The top down approach also gives us a process, which is step by step and can be applied in real time. Unlike the bottom up approach , where we should be going behind all the stocks to see the strength, in the top down approach we let the market tell us which is stronger at the given time.
Stan Weinstein calls this top down approach as – FOREST TO TREE APPROACH.
Identifying Sector leaders:
After evaluating where the market is heading in the near future, the next step is to hunt down the leading sectors. We all know that the market topped in October 2021 and from then on we are yet to see a recovery to break that high. The drawdown has been around 18% from the top for Nifty 50. Though the drawdown 18% is massive, we are far better to global corrections where the drawdowns are as severe as 27% (SPX 500) and are yet to recover.
Retailers who were unaware of understanding the real importance of drawdowns would have suffered a massive loss during this period.
Relative strength of the sector:
Leadership in sectors usually arises well before the market moves. The leader usually shows signs of strength even when the broader markets are not in good shape. One important sign of leadership is the relative outperformance of the sector against the broader market, also called Relative strength.
“Relative strength is the strength of a particular stock or a derivative or commodity in relation to the bench mark. It is calculated by dividing the price of that particular stock by the benchmark value. Higher the resultant value higher is the relative strength and Vice Versa. It is calculated on a daily basis and is smoothened out as a 120 / 180 / 200 Moving averages. Negative values are plotted below a Zero Line and Positive values are plotted above a zero line.”
If you would like to know more about relative strength read the books of Tom Dorsey and if you want to dive deep into Relative strength in an Indian perspective you can follow Mr.Premal Parekh, whose trading strategies are exclusively focused on relative strength.
Let us see the sectors that has outperformed Nifty in the past six months as on date (November 2022):
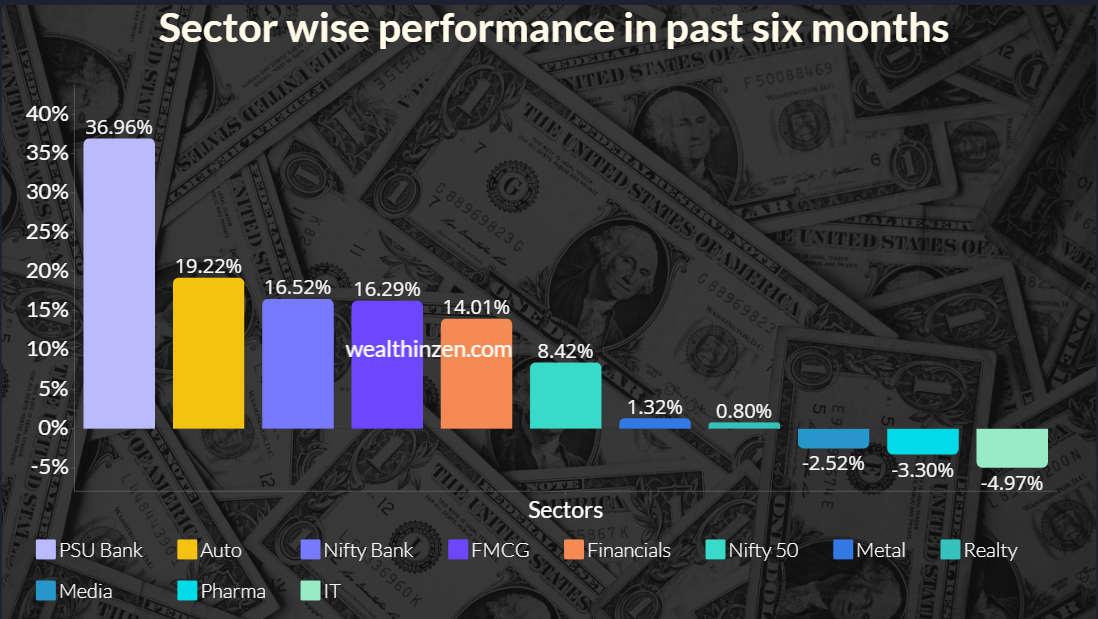
In the above picture you can see that Nifty has given 8.42% return in the past 6 months while the top performing sector is the PSU Banks, followed by Auto, Nifty bank, FMCG, financials.
This means when the market is in a downtrend or in a consolidation mode, these sectors have outperformed showing relative strength.
So, now we will have these sectors in our priority mode. Let us see the Relative strength line of these sectors below:
The relative strength line is smoothened for 200 day moving averages and is plotted in Trading view:
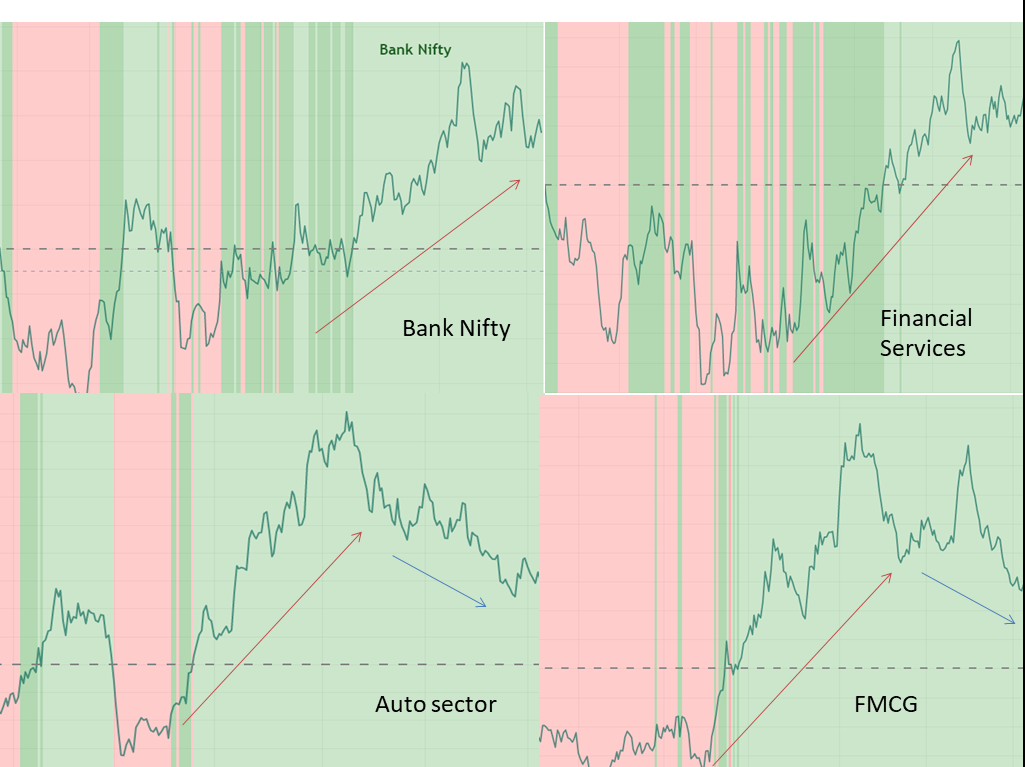
From the above picture you can see that the banks, financials, Auto and FMCG are staying above the zero line for quite a long time. In particular, see the relative strength lines of banks and Financials, forming continuous higher highs and higher lows.
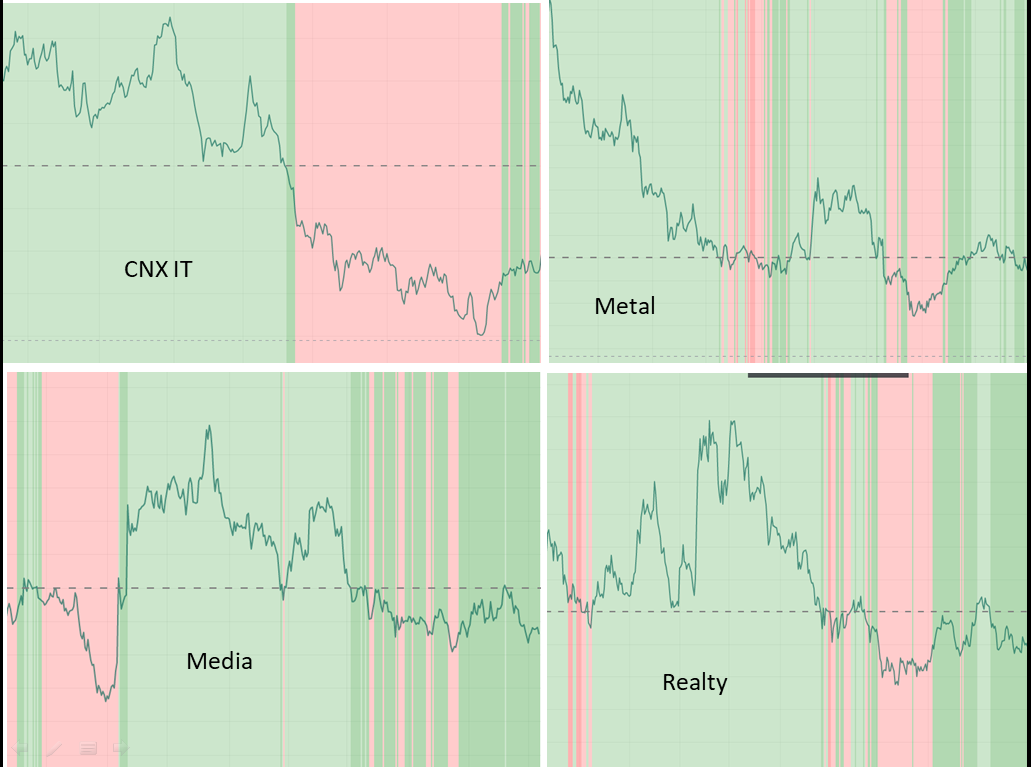
I will also show some examples of the poor relative performance of some sectors, which one can avoid.
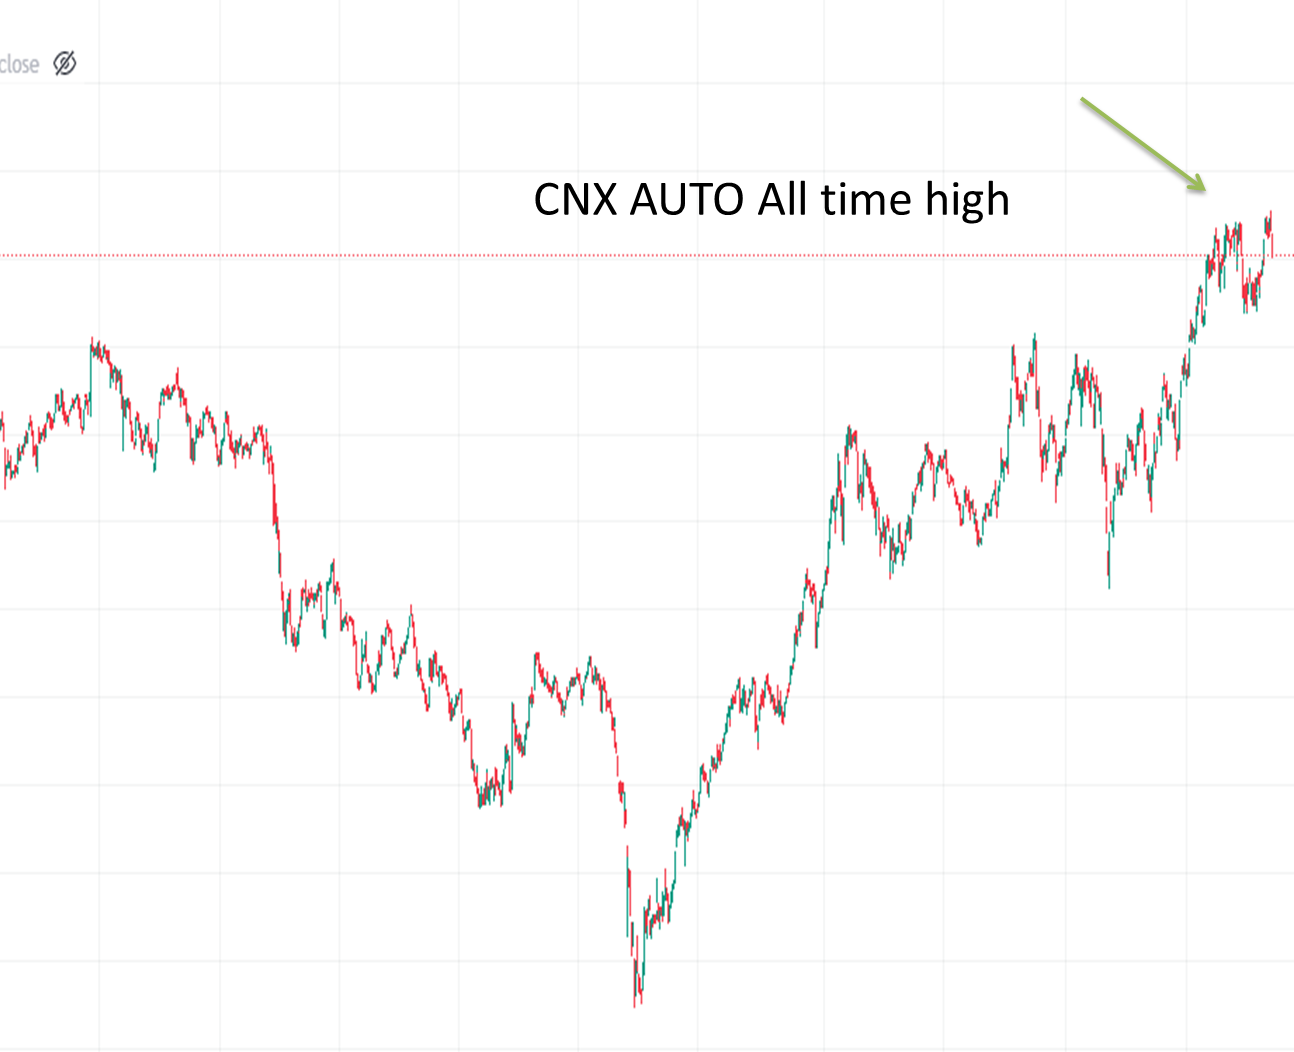
Select the sectors at the All Time High:
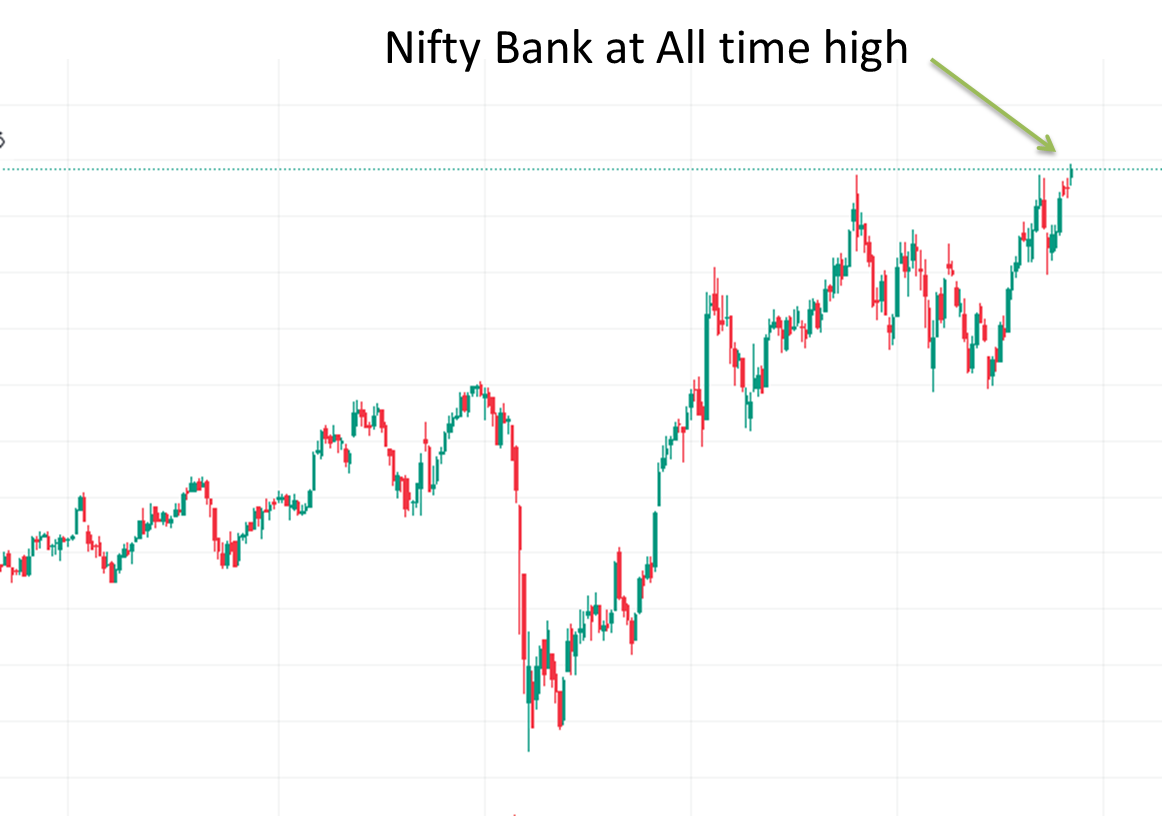
Once we have pinned down the sectors by using the relative strength, the next thing we have to see is whether the sector is trading at an ALL TIME HIGH or not.
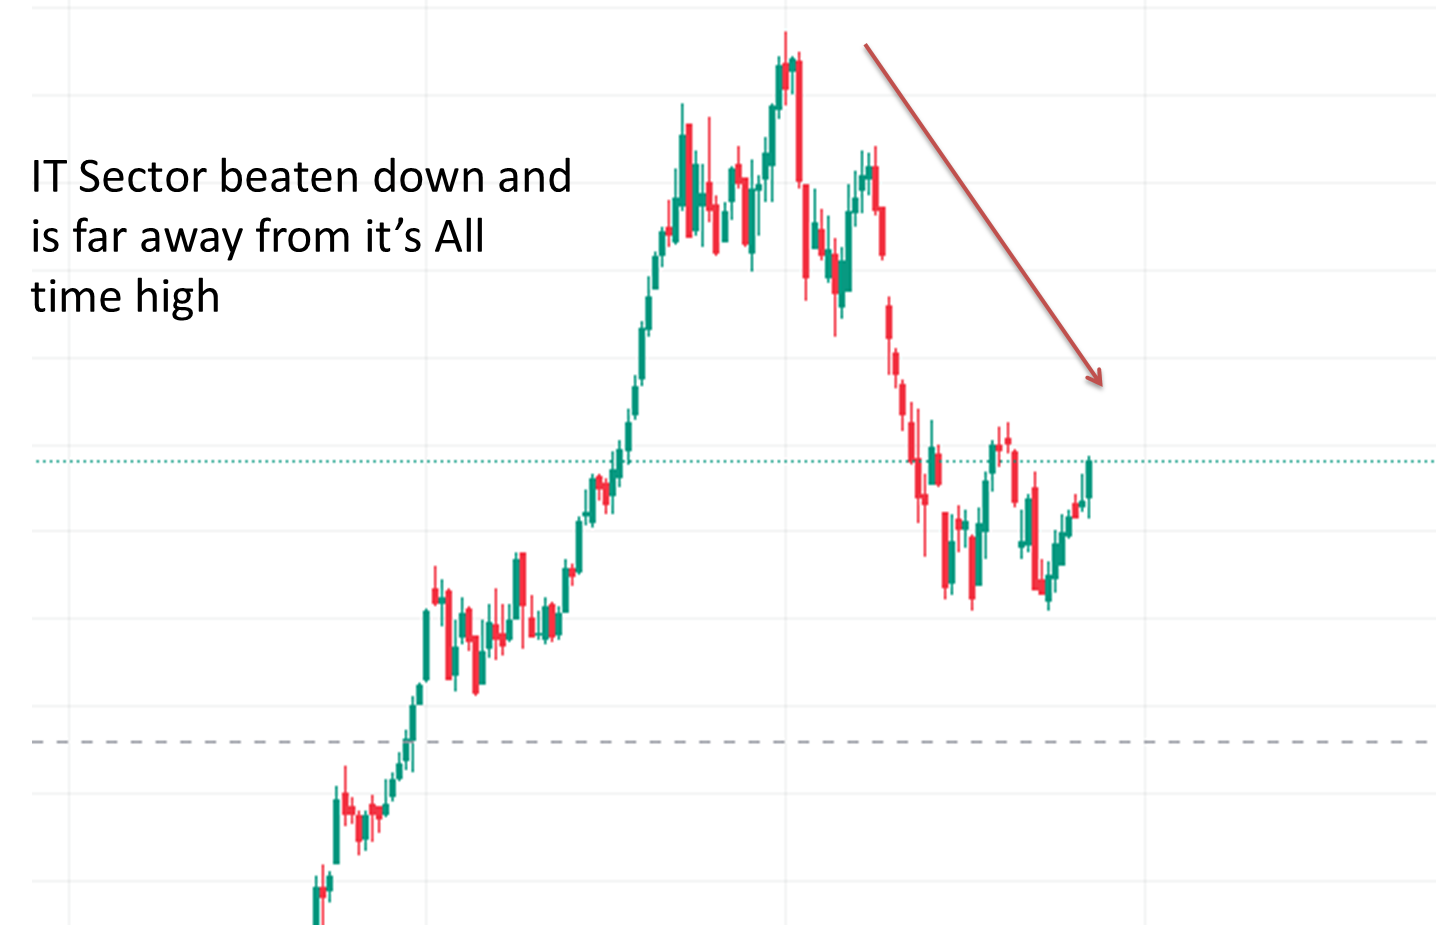
Of the sectors we selected, all are trading at or near the all time high. Avoid the sectors that are not trading at or near the all time high or beaten down a lot.
See the image of Nifty Bank and Nifty Auto:
Avoid sectors that are beaten down like IT: (All are weekly charts)
Selecting the stocks from those sector:
The next big thing for us is to hunt down the stocks and have a limited watchlist. Having a limited watchlist helps us focus on things more clearly and reduces stress.
Though I am not going to give out any stock names, I will show some examples of which stock I will prefer and how I go about it. Kindly don’t take any of the stock names as a stock recommendation. Please do your own research before investing.
Select stocks with good fundamentals:
One need not be Warren Buffet to analyze a stock fundamentally. We are not a value investor who analyzes the breadth and depth of the stock. We just need to keep some of our basic fundamental criteria, that a stock should pass.
The first thing I look for is whether the stock is in at least the Nifty 500 index. If a stock is not even on the Nifty 500 index I avoid them completely. Issues like operator frauds, hitting upper circuits too often, lesser liquidity, random gap downs are too much to handle for me.
Other criteria worth looking into can be:
- Increasing Earnings per share
- Increasing sales growth
- Increasing Operating profit margin
- Low debt to equity ratios etc.,
For example, if we are looking into the auto sector, I would be more interested in stocks that have increasing EPS every quarter.
Example of Mahindra is shown below:
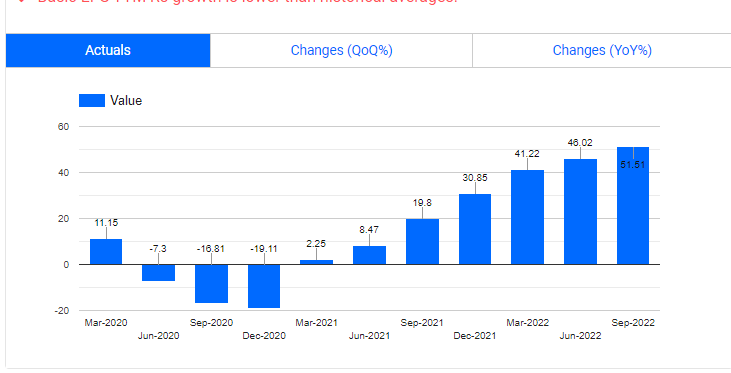
Source : Trendlyne
See the increasing EPS every quarter.
But, note that these criteria are just to make sure that we don’t select a stock that is poor in financials. We also want our value investors to keep buying / holding the stock, along with us.
We look into the best of the best stocks so that we can keep our positions very limited. The growth rate of our account size is inversely proportional the number of positions we have in our portfolio. So, one should be very mindful in selecting stocks.
Select stocks that are breaking into All time high:
Just, imagine the stock is venturing into the all time high zone, when the market pitch has been a dampener. Imagine, how bullish the same stock can become when the pitch becomes dry and is ready for the up move?
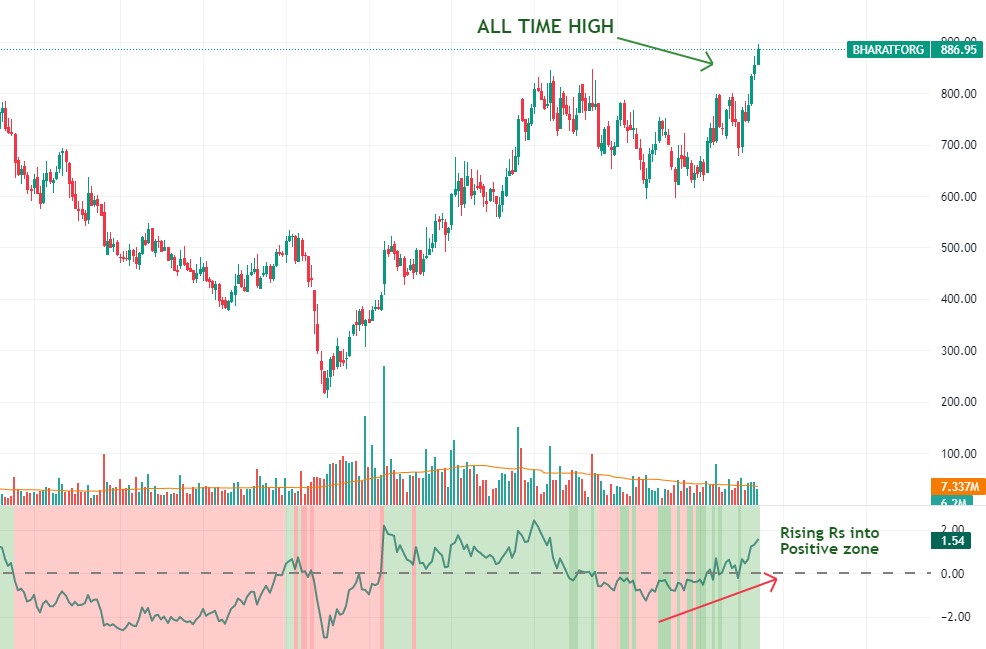
So, always prefer stocks that are in All Time High or select stocks that are trading not less than 25-30% from their all-time high.
I will show two examples – First is the stocks that should be preferred:
Like the Bharatforge from Auto sector,
Second, is the stocks that I would like to completely avoid even if it is from the same sector:
Example : Exide Industries
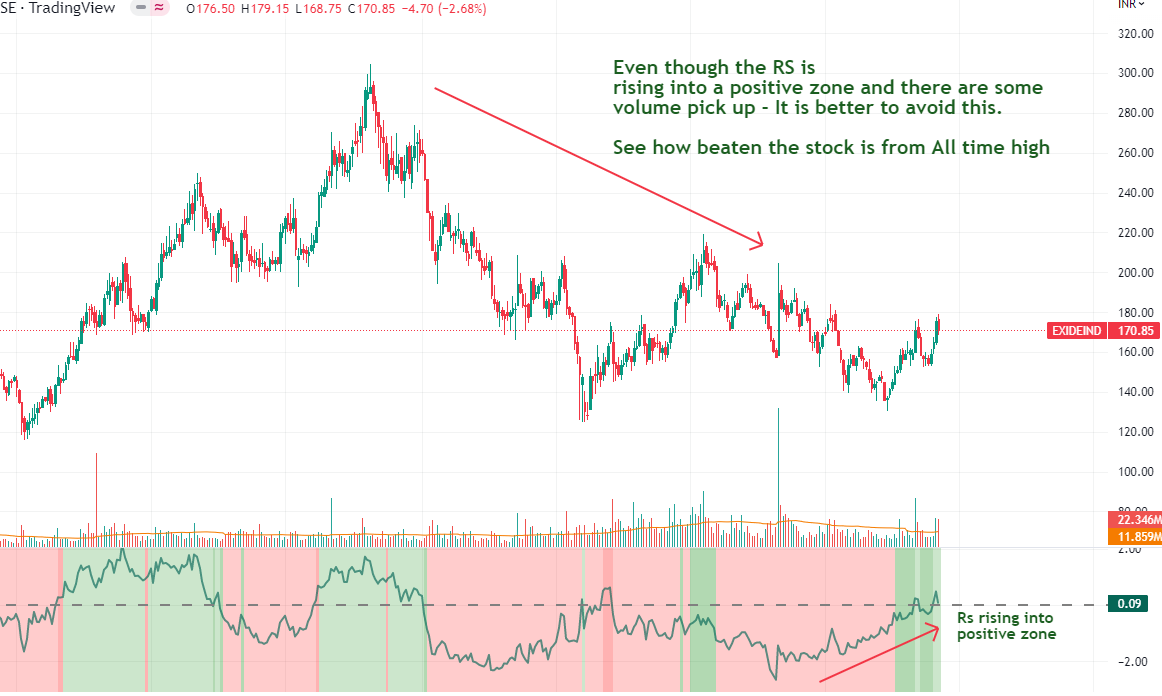
Diversification of stocks:
I hope that I had explained in my best possible way on how to select stocks based on relative strength. I would like to point out some other aspects also.
Once you have pinned down some fifteen to twenty stocks you should narrow it down further. Now, the stock allocation should be in such a way that it comprises all of the good performing sectors.
For example, If you are planning to have an eight stock portfolio, have two from banks, two from auto, two from financials, other two from FMCG / Consumption.
Proper entry:
You would have noted that some sectors or stocks are at an All time high. So, you have to look for a proper entry point. That entry point may be a break out from base formation, pullback based on moving averages. FIB retracements etc., Don’t jump into the stock right away. Control the Fear of missing out (FOMO).
Holding to the Positions once entered:
The next big problem one faces after entering into the position is waiting out patiently. Patience is an art, one has to develop to win big here. Once the bear market recovers and it moves into higher highs, it is very common to see other sectors/stocks showing strength and your position’s relative strength may be going down. It is very common for the relative strength line to go down a little, consolidate and then rise again to form a new high. So, stick to your exit strategies. It can be anything like relative strength line moving below zero line, moving averages, pivot points etc., Make sure you stick to it.
Journaling your trades at regular intervals and analyzing it will help greatly. I had written an article on how to make a perfect trading journal. You can check it out.
This type of stock selection process, works best when the market is recovering from a significant correction or a bear market. Holding these stocks for a longer time period has an intrinsic edge to success. Make time as your friend. In my coming articles I will try to write about the stock selection process, in the midst of a bull run based on momentum and other criteria. If you like my writings and would like to receive my insights kindly consider subscribing to the newsletters.
Disclaimer: I had written the article in my perspective. You may have different views and different selection criteria for selecting stocks, which may also be right. That’s the beauty of stock market. You are completely free to disagree with the views mentioned and all the stock names are not recommendations. Please do your research before investing.


It was excellent article
Hi Vipul, Thanks for the feedback. Happy Trading