 by
by Redington – April to August 2023
Hi all !!
I am going to share a losing trade that I took with you all. This is a series of articles I am publishing from time to time in the name “ Trading Journal series” where I will share my trades. I don’t worry about what others think of my trades. I am comfortable with a particular style and you will be having your own style. That’s completely fine. I am just sharing my thoughts with you all. If you are new to trading you can also try journaling the trades like this. Also, you can read my article on “How to make a perfect Trading Journal like Mark Minervini?”
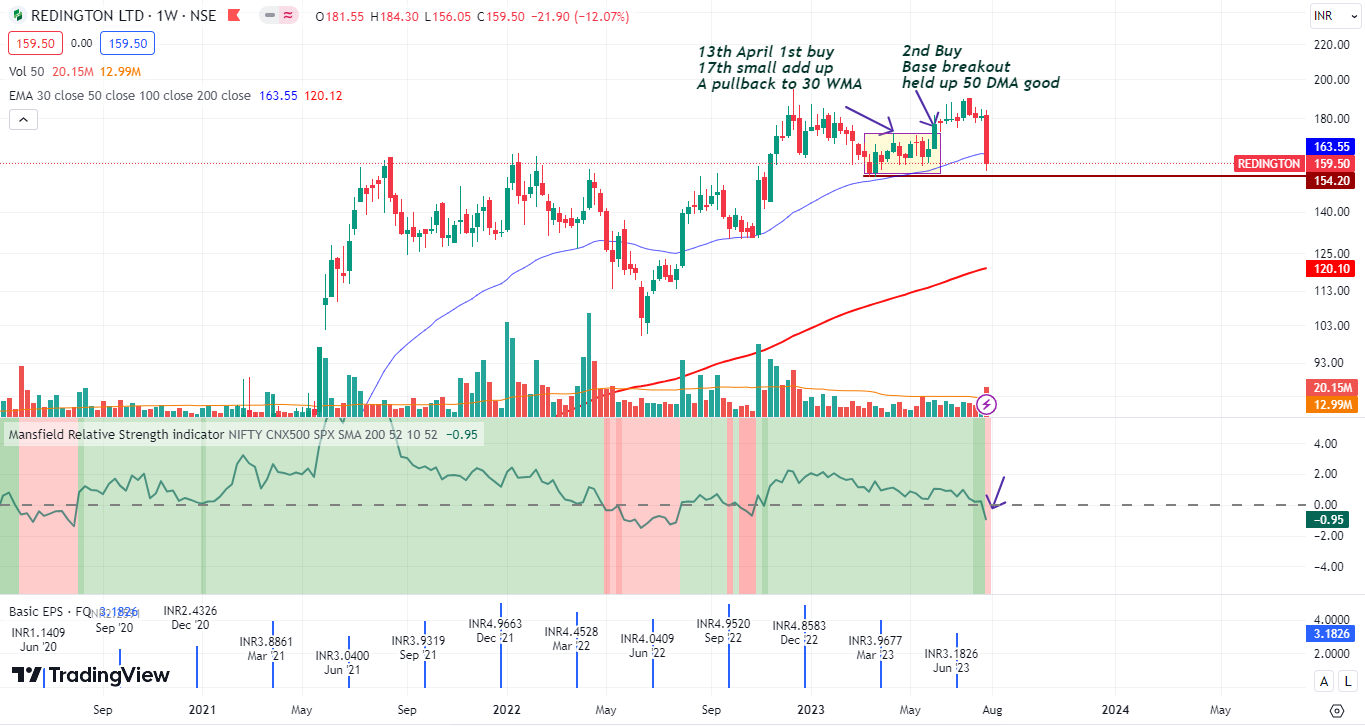
The market was finding its bottom and slowly started rising up. Redington had a recent run-up in the past 6 months and has reached an ATH around Nov 2022. Now it was in a pullback mode. It started to consolidate for months. And in all these days it has maintained not to breach the breakout monthly candle. (See arrow).
I prefer stocks trading near the all time high zones.
See the monthly chart: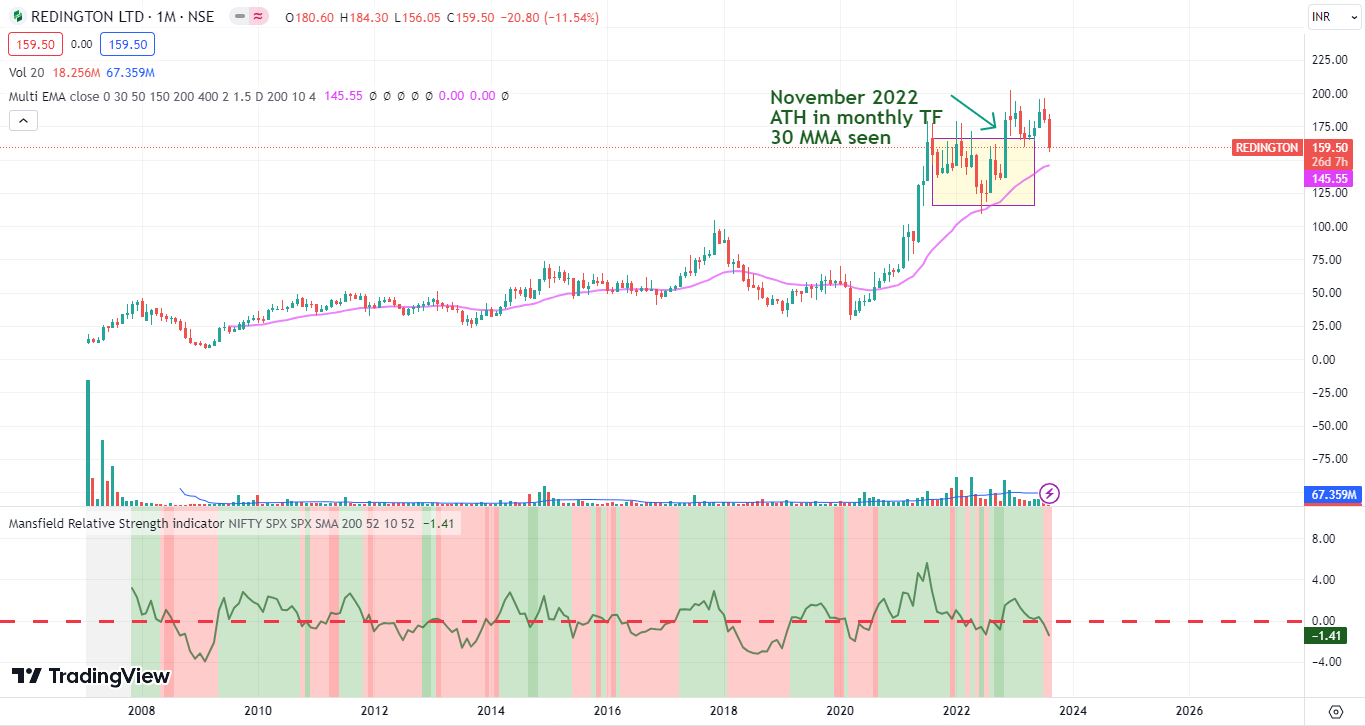
I noted this stock and was waiting for a proper entry. I was looking for a weekly chart for entering a pullback.
When the stock pulled back to 30 WMA I bought the first tranche. Later I added some on the next day’s fall.
In hindsight, I can see that the RS line was heading lower and not rising up. But I thought that since the RS line has recently touched the Zero line and has recovered from it in WTF (Weekly Time Frame) it is normal. Also after touching the Zero line, RS started to make a high from its previous low.
However, the point to note is the day (week) I bought it the RS was heading lower and was not strong.
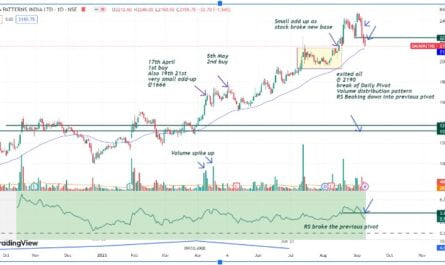
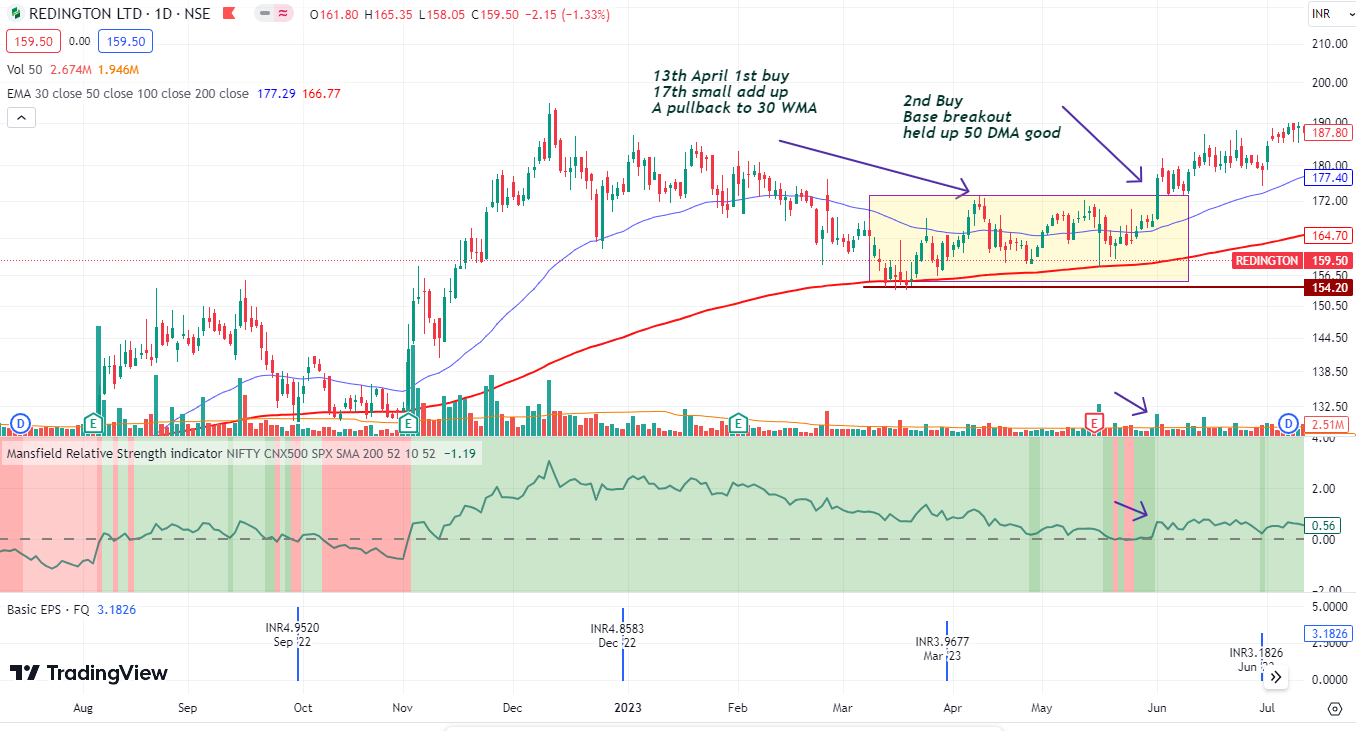
I bought the second tranche in June as shown in the chart below. It seemed to be a good buy. Good breakout after a consolidation from 30 WMA. However, the volume was not impressive and the RS line improvement was also not that great.
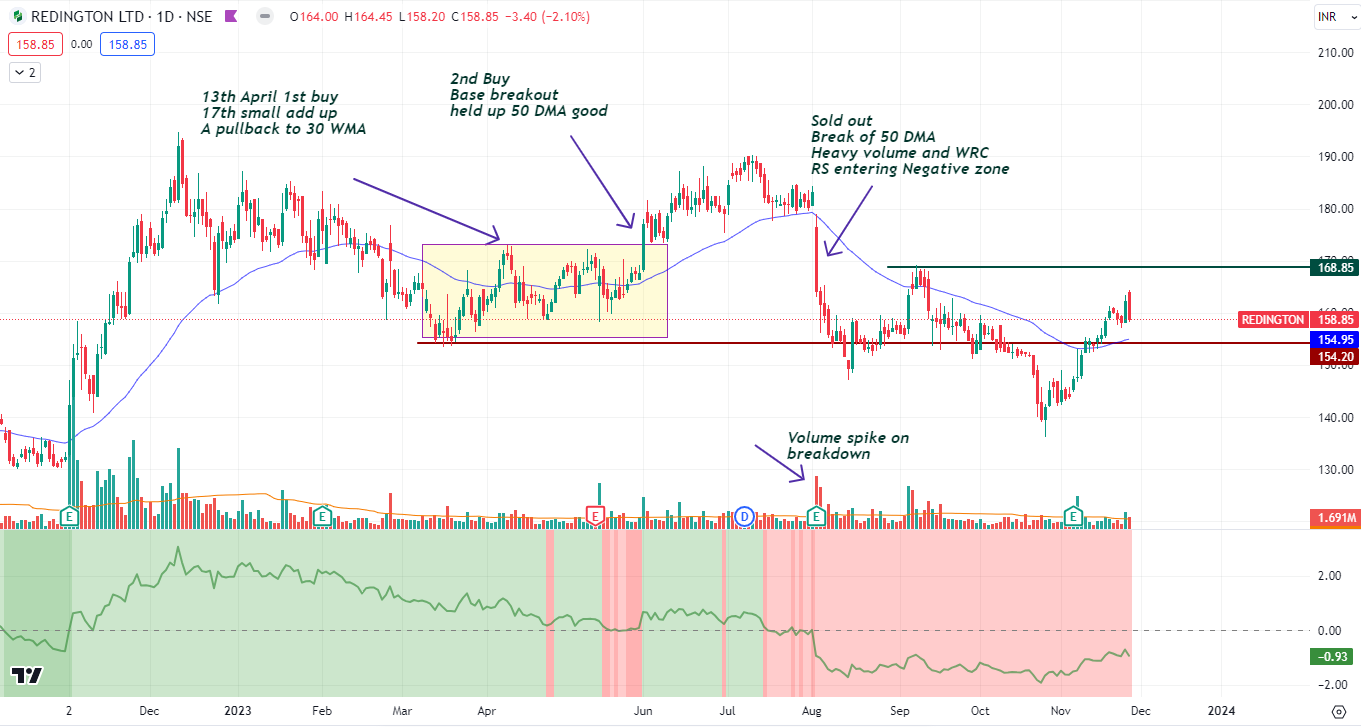
See the daily chart when I bought the second tranche. I can see that the price holds up well by 50 DMA and after a small consolidation, it breaks up. Volume spike seen in daily and RS line also spikes up though it is not appreciated in the weekly chart shown above. All seemed well till now.
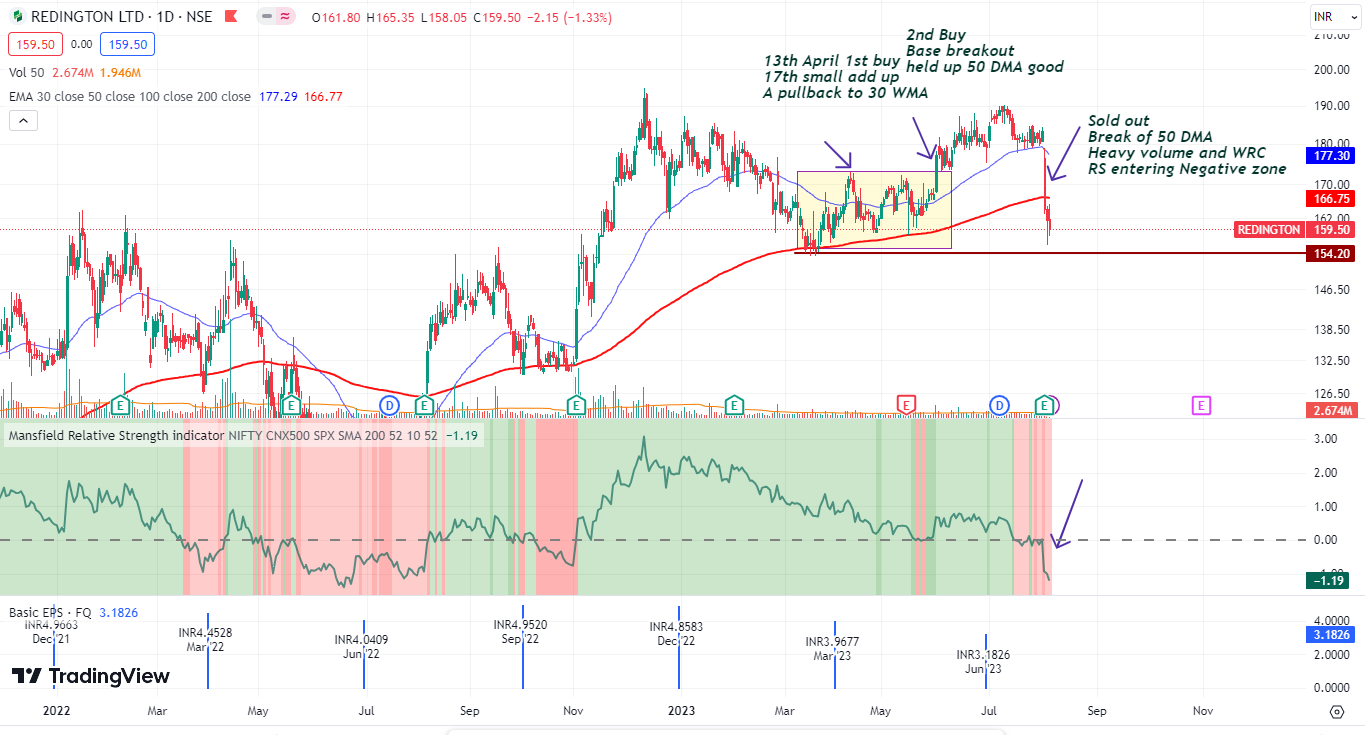
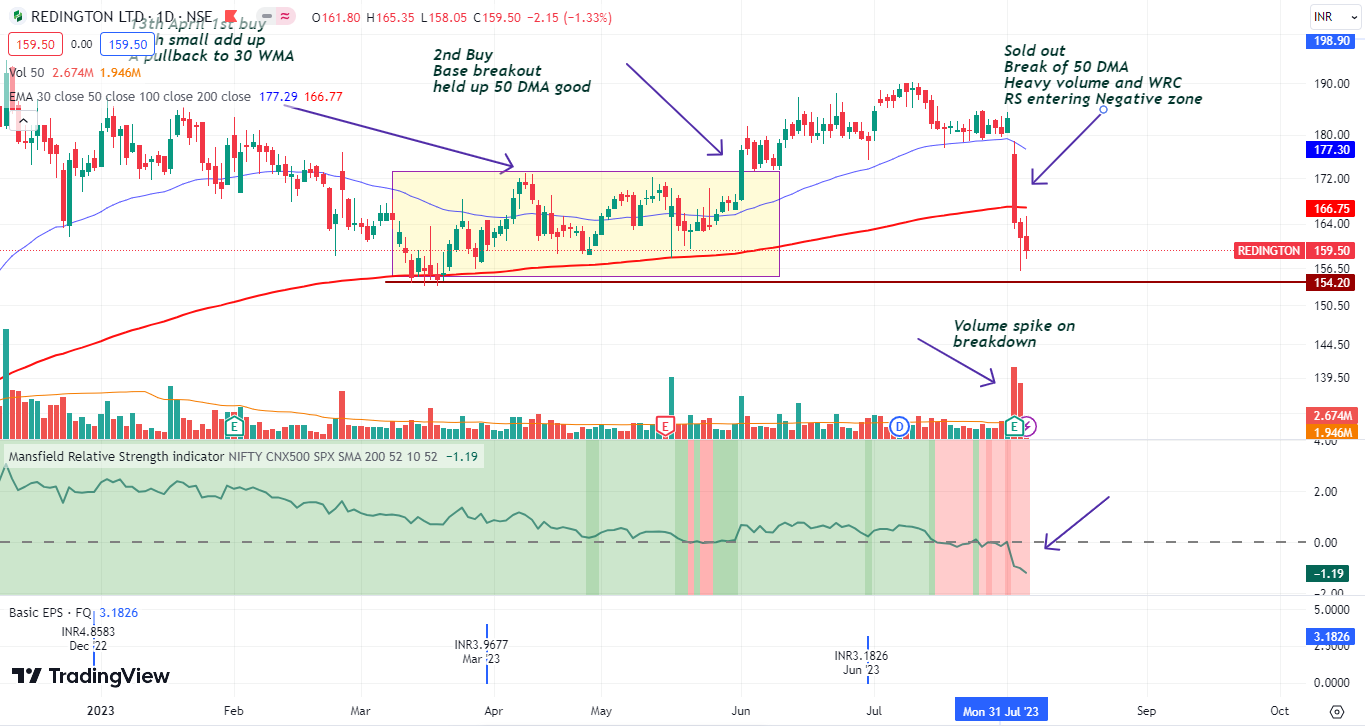
However, after that, the stock stalled a lot, took support twice at 50 DMA, but finally gave up on August 2nd when it gapped down to cut through 50 DMA decisively with Volume and also RS Line entering negative zone with ease.
See the volume spike when the price went below 50 DMA
This is the stock as of today (Nov 2023). Even after three months after the fall the stock is still well below the all time high and the RS Line is still below the zero line.
DISCLAIMER – Kindly understand that there are “N” number of ways to trade. My entry, position building techniques, and exits can be done differently by different traders. For some it may look like a late entry, while some may think that I exited too soon. It all depends upon the psychological makeup and the risk profile of the trader.
So, if some points seem to be irrelevant or if you think that it could have been done the other way around, I agree with you completely. It’s just that, this is how I trade and my trading style may change in future as I evolve as a trader.