 by
by Have you seen the You-tube ads where the advertiser is claiming that there is a vast difference between “ How the common public sees the market and How the Institutions see the market?” Yes, maybe it is true. What can be a potential buy point for the institution may be terrifying for the retailer as the stock is already trading at an All time high or it may have fallen so much that a commoner will be worried to buy it due to pessimism. It is these emotions attached with the retailers the institutions want to play with and extract the most from them.
Most retailers think that institutions deceive them. But, remember that no institution can stop you from thinking their way. Right? We are free to make our decisions based on our own set of rules. Nobody is going to say, “ You are not from the institutional side and so You can’t buy so and so stock at so and so price.
We are free to buy any day, any time and at any price we want. Then is it worth blaming that the institutions deceive the retailers? A big no. Yes, definitely institutions don’t like the common retailer to buy at the exact same price they want to buy. If everybody wants to buy at the same point then who will sell those shares to them?
But, what if we can spot a point where the institution buying is happening and we can also travel with them instead of fighting against them? David Ryan, a three time US Investing champion, disciple of William O Neil, manager of Ryan Cap Hedge has given a three step method popularly called as ANTS Indicator, to detect the institutional buying when it happens in a stock.
In this article, I will share my thoughts about the ANTS indicator and how one should use it to their trading excellence. I will also share how to plot the indicator in the Trading view site for free. Please, read the entire article to fully understand the concept.
What is ANTS Indicator?
When the indicator was first developed the developer used to mark those days with institutional activities with a black dot on top of that day, in the chart. Over a few days the marked black dots resembled ants climbing over a wall. Hence the name – ANTS indicator.
The indicator factors in Momentum, Volume and Price. A specific combination of these three makes the crux of the indicator.
Any stock that exhibit institutional buying, should have the following three criteria met as per David Ryan:
Momentum:
Stock should be in a continuous up move. It should be up in at least 12 out of 15 days prior to the move.
Volume:
Volume should be rising at least 25% greater comparatively in those days. Particularly there should be a continuous increase in volume as the stock moves up in that 15 days.
Price:
The price of the stock should have increased by at least 25% or more in those days.
The logic behind ANTS INDICATOR:
The logic is simple but is noteworthy. See, when institutions like mutual fund houses are buying a stock, they can’t buy all the required quantity in a single shot. They can’t get all their orders filled in a single day. They should wait for the sellers.
As the price moves up, the retailers who were waiting to exit the stock, see some profit. They happily sell their shares and provide the required liquidity. It results in additional buying from institutions thereby increasing the momentum and also the price significantly with more green bars than the red ones.
Institutional buying as per David Ryan usually takes at least 12-15 days. Also, since the institutions buy them in very large quantities, the volume increases rapidly in those days. Volume increases in such a way that it increases on a constant basis instead of some random one day spike.
How to plot ANTS indicator in Trading view:
This is the most simple thing one can do. Thanks to JohnMuchow who has designed the ANTS indicator for free use in Tradingview.com
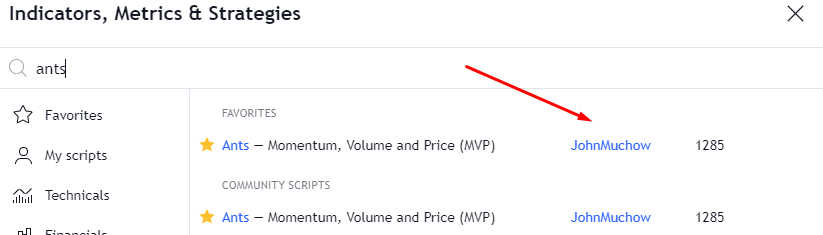
Just go to the indicator section in the trading view and search for ANTS- (MVP) Indicator by JohnMuchow and click it.
You have now plotted the ANTS indicator. This is how the ANTS will look like in the chart. See the image below with red arrows pointing at the so-called institutional buying.
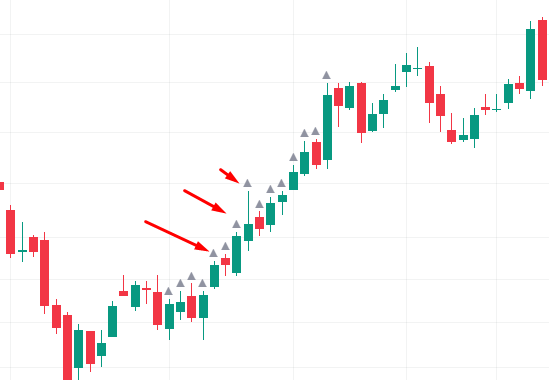
But the indicator is still more informative. The color of the Ants changes on the basis of the criteria met. In the above example only the momentum criteria is met. That is the price is up in 12 out of 15 days. But the price change is only 18%. So it is shown in gray color.
See the image below:
Based on the criteria met, the color of the ants changes.

As you can see – the color changes to green only when all these three criteria are met. You can use it to see how it works for you.
Live example of ANTS indicator:
As of today Nov-2022, when I was going through the charts I found Ambuja cements that fit more likely into the criteria.
See the daily chart of Ambuja cements. You can see the institutional buying (As per David Ryan) is happening and is marked with the orange Ants.
As per the indicator color it says that only the momentum and volume criteria is met. But however you can see that the price change in those periods is also around 47%. Thereby the price criteria is also met.
Maybe there is some technical glitch in the indicator. But it does not matter. The concept is the same irrespective of color.
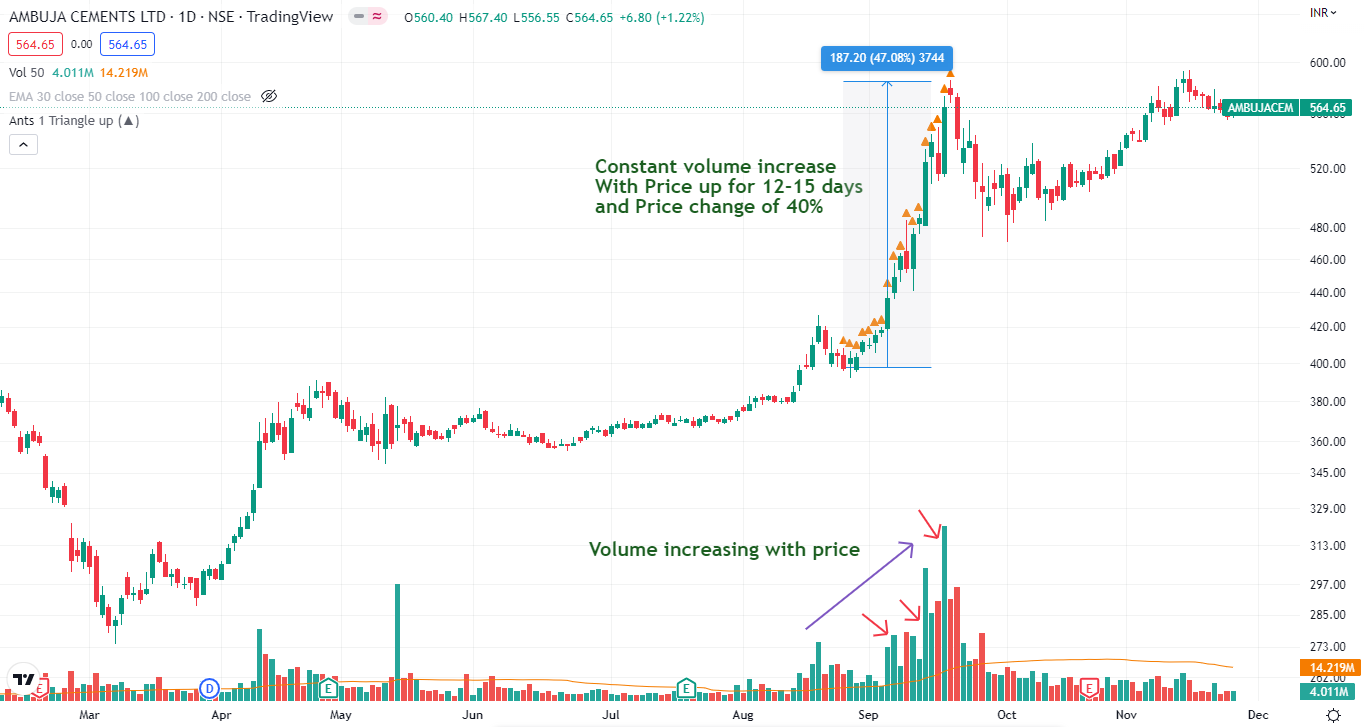
Another important and interesting thing to note is, as the price keeps on increasing with momentum the volume also catches speed and the top most volume has exactly coincided with the recent major top.
Institutions finished buying?? Not sure. But possibility is always there. Also, at the last day of the top, see the climax. Retailers got trapped. A classic sign of retailers’ trap. But, now we know that the movement is not going to end as easily like that. It is most likely to continue. So, we can look for a better entry point instead of jumping right away.(Kindly note that the stock is not a recommendation. Just for education purposes only.)
Let us see another example – IRFC:
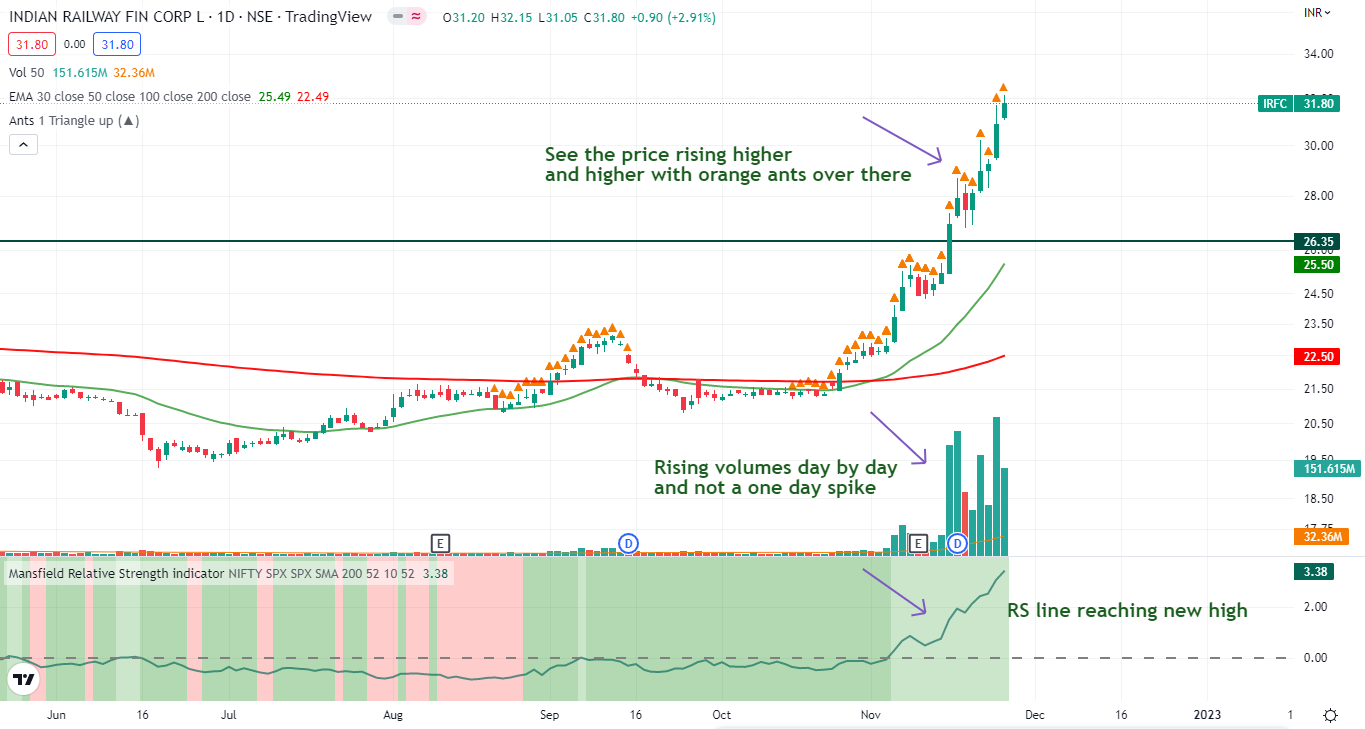
The above is the daily chart of IRFC. Tremendous price action in place meeting all the criteria of momentum, price and volume. This is a perfect case study. One can wait and enter into the stock at the right time. (Not a recommendation, do your research).
wealthinzen.com
Limitations:
- The indicator is not a leading indicator. There is no first mover advantage. The indicator tells that institutional buying might have happened in the stock. However, the stocks with these characteristics are not going to settle down soon and it will run up decently before fizzling out. So, trade with caution, look for proper low risk entry set ups and do proper position sizing before putting your hard earned money.
- Also, since it is somehow like a momentum play if the entry is not proper, the risk reward ratio may get skewed, thereby increasing drawdowns, which will hamper your account size.
Other points to consider:
Always try to look for these types of patterns after a market correction. You need not wait for a crash but at least let the market correct by 10% before you initiate fresh positions in these types of momentum stocks to get a better risk reward. Selecting stocks after a bear market should be done in a systematic way.
Once you spot such a stock, don’t jump to buy it immediately. The market will give you enough time to time the trade. Just like you time for sector rotation to happen you should time the stock entry also. Wait for a pullback, consolidation and breakout.
Mix and match with other analyses like whether the stock is RS positive? Whether any overheard nearby resistance there?. Whether the stock is from a favorite sector? How are the sister stocks performing? Whether the price shows strength during consolidation or not?
See the Daily chart of Hindalco below:
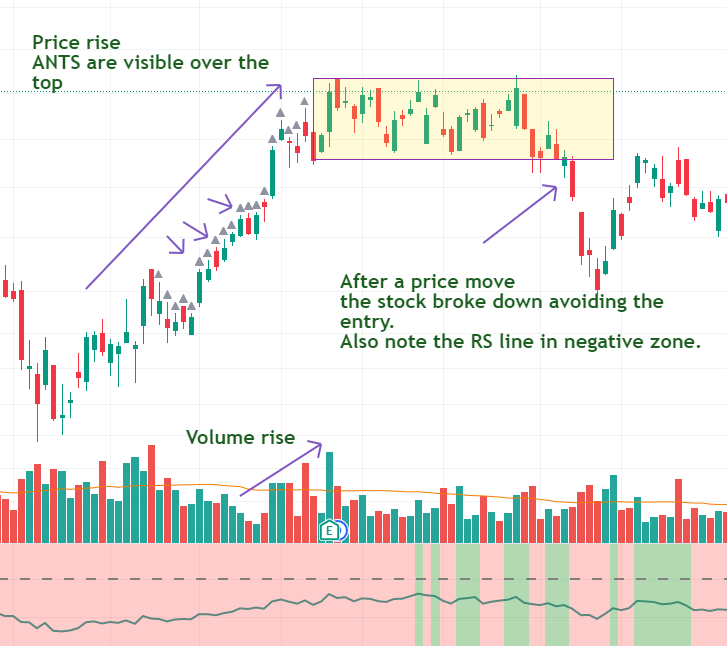
.
Anybody who has entered the stock without a proper entry plan would have been in soup. Instead, if one has waited for a popper consolidation and then entered then he would not have gotten the trade itself as the stock broke down after consolidation.
Look for sister stock actions:
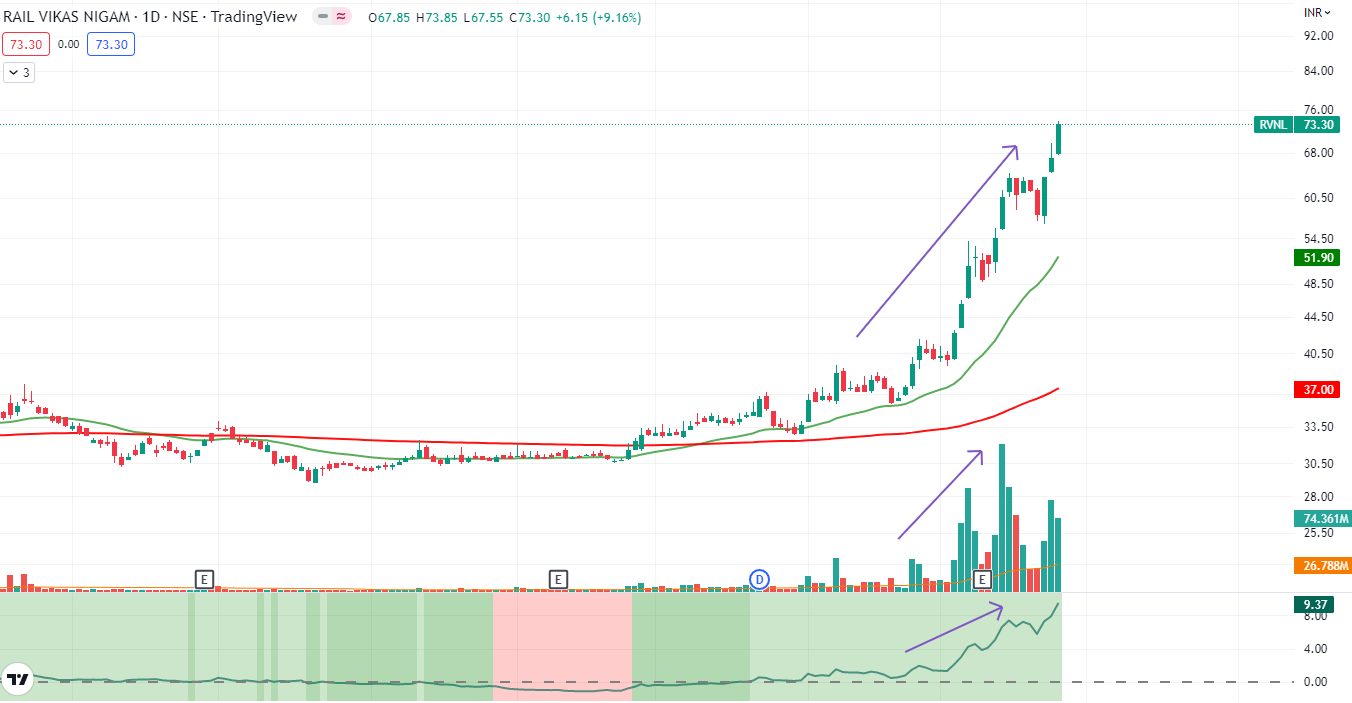
Sister stocks are nothing but stocks related to the same sector. HDFC Bank and SBI are sister stocks for example. Even now, see what IRFC, RVNL(Rail Vikas) is doing. Similar pattern. Rising price, rising volume and rising momentum. See, the same pattern in all PSU banks, Canara bank, Union bank of India, Punjab National Bank. There is something phenomenal happening around the public sectors.
RVNL Daily chart pattern for reference:
Conclusion:
I had tried my best to explain about the ANTS indicator in an easy way possible. Hope it would have been a good read. Kindly do your own research before taking any positions. If you like my writings, consider subscribing to my newsletter, to get my insights delivered right into your inbox. Share the article with your friends if you feel it is a good read.
Happy Investing!!!


Hi, I have quick question about how I can identify which all of the stocks have met with this ANTS indicator by end of day instead of doing one by one stock in the trading view ? I tried with trading view but I can see stocks one after other with this indicator.
is there any website existed where I can see all the stocks list met with this criteria ?
Thanks,Sateesh
Hi. You can try chartlink website which scans the stocks meeting with the criteria. See the link https://chartink.com/screener/copy-ants-3
However, be sure that these scanners are not that much reliable and may miss some good stocks and also some stocks scanned may not meet the exact criteria. But you can check this out. Best is to see chart by chart. I don’t rely too much on scanners.